Data visualization and analysis handbook (Apr 2019 v2)
Examples of visualizations: 8. Dot (Lollipop) Chart
Index
- Data visualization check list
- Chart selection
- Examples of visualizations
- Examples of makeovers – from bad to good
- How to develop a story with visualizations
- Resources
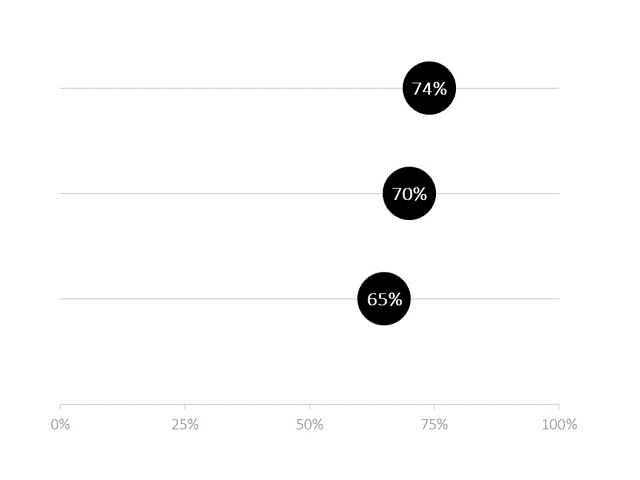
8. Dot (Lollipop) Chart
Dot plots are similar to bar charts. Imagine a bar chart. Where do your eyes go? Our eyes are naturally drawn to the ends of the bars. Our brains are comparing the lengths of each category. A dot plot takes advantage of that brain function by placing a circle or dot at the end of each bar. When you peel away the bar, you're left with a dot plot.
Example 1