Binning data with Pandas qcut and cut
- References:
- Binning data
- The concept of binning data can be best illustrated by Histogram that put data into equal-distance buckets (or bins)
- Any data series can be binned either by equal distance (i.e. each bin has same distance) or by equal size (i.e. each bin has same number of samples)
- In Pandas, there are 2 functions help with the binning data task, and they are
qcutandcutqcut: bins data into equal size bins, namely, each bin has same number of samplescut: bins data into equal distinace bins, namely, the distance in each bins is the same but number of samples in each bin may be different.
- Examples: the following script demostrates how to use qcut, cut, and combine these 2 functions with
rolling- create equal size bins with
qcutand plot bins in bar chart - create equal size bins with
qcut, assign labels to each bin, and plot bins in bar chart - create equal-distance bins with
cutand plot the bins (with bar chart) - create qual-distance bins with
cutandrollingand plot the bins (with bar chart) - create equal-distance bins with
cutandrolling, calculate the mean, and plot the bins (with bar chart) - create 5 equal-distance bins on rolling normalized data with rolling
cutand plot the bins (with bar chart)
- create equal size bins with
Load libraries and download data
import pandas as pd
import numpy as np
import os
import gc
import copy
from pathlib import Path
from datetime import datetime, timedelta, time, date
#this package is to download equity price data from yahoo finance
#the source code of this package can be found here: https://github.com/ranaroussi/yfinance/blob/main
import yfinance as yf
c:\python37\lib\site-packages\requests\__init__.py:104: RequestsDependencyWarning: urllib3 (1.26.9) or chardet (5.0.0)/charset_normalizer (2.0.12) doesn't match a supported version!
  RequestsDependencyWarning)
df = yf.Ticker('GSK').history(period="max", start='2000-01-01')
df.head()
| Open | High | Low | Close | Volume | Dividends | Stock Splits | |
|---|---|---|---|---|---|---|---|
| Date | |||||||
| 1999-12-31 | 19.986372 | 20.053291 | 19.897147 | 19.941759 | 136724 | 0.0 | 0.0 |
| 2000-01-03 | 19.964064 | 20.097900 | 19.629470 | 19.830227 | 545423 | 0.0 | 0.0 |
| 2000-01-04 | 19.830232 | 19.830232 | 19.272575 | 19.317188 | 360150 | 0.0 | 0.0 |
| 2000-01-05 | 19.584855 | 19.964060 | 19.451017 | 19.964060 | 472451 | 0.0 | 0.0 |
| 2000-01-06 | 19.763303 | 19.807915 | 19.272565 | 19.674078 | 837407 | 0.0 | 0.0 |
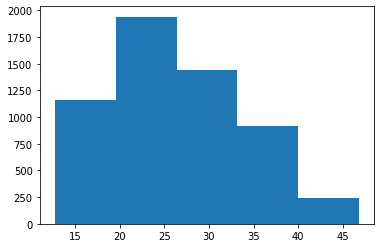
Histogram
df['Close'].hist(bins=5, figsize=(6, 4), grid=False)
<AxesSubplot:>
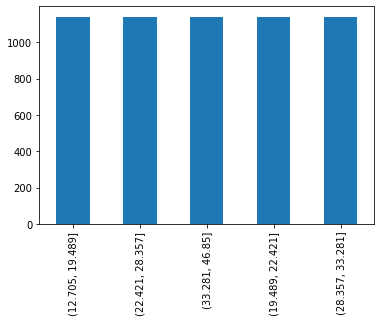
Create equal-sized bins (same number of samples in each bin) with qcut
create 5 equal-size bins and plot the bins (with bar chart)
#create 10 equal-size bins
df['qcut'] = pd.qcut(df['Close'], q=5)
df['qcut']
Date
1999-12-31    (19.489, 22.421]
2000-01-03    (19.489, 22.421]
2000-01-04    (12.705, 19.489]
2000-01-05    (19.489, 22.421]
2000-01-06    (19.489, 22.421]
                    ...
2022-08-17     (33.281, 46.85]
2022-08-18     (33.281, 46.85]
2022-08-19     (33.281, 46.85]
2022-08-22     (33.281, 46.85]
2022-08-23     (33.281, 46.85]
Name: qcut, Length: 5698, dtype: category
Categories (5, interval[float64, right]): [(12.705, 19.489] < (19.489, 22.421] < (22.421, 28.357] < (28.357, 33.281] < (33.281, 46.85]]
df['qcut'].value_counts()
(12.705, 19.489]    1140
(22.421, 28.357]    1140
(33.281, 46.85]     1140
(19.489, 22.421]    1139
(28.357, 33.281]    1139
Name: qcut, dtype: int64
df['qcut'].value_counts().plot(kind='bar', figsize=(6, 4), grid=False)
<AxesSubplot:>
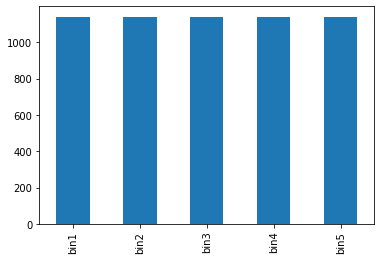
create 5 equal-size bins, assign label to each bin and plot the bins (with bar chart)
#create 10 equal-size bins
df['qcut'] = pd.qcut(df['Close'], q=5, labels = [f'bin{i+1}' for i in range(5)])
df['qcut']
Date
1999-12-31    bin2
2000-01-03    bin2
2000-01-04    bin1
2000-01-05    bin2
2000-01-06    bin2
              ...
2022-08-17    bin5
2022-08-18    bin5
2022-08-19    bin5
2022-08-22    bin5
2022-08-23    bin5
Name: qcut, Length: 5698, dtype: category
Categories (5, object): ['bin1' < 'bin2' < 'bin3' < 'bin4' < 'bin5']
df['qcut'].value_counts().sort_index()
bin1    1140
bin2    1139
bin3    1140
bin4    1139
bin5    1140
Name: qcut, dtype: int64
df['qcut'].value_counts().sort_index().plot(kind='bar', figsize=(6, 4), grid=False)
<AxesSubplot:>
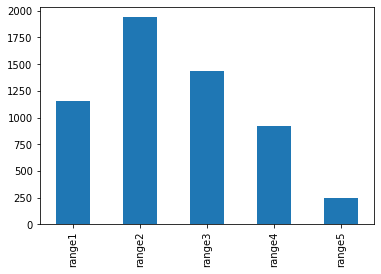
Create equal-distance bins (same distant but different number of samples in each bin) with cut
create 5 equal-distance bins and plot the bins (with bar chart)
df['cut'] = pd.cut(df['Close'], bins=5, labels = [f'range{i+1}' for i in range(5)])
df['cut']
Date
1999-12-31    range2
2000-01-03    range2
2000-01-04    range1
2000-01-05    range2
2000-01-06    range2
               ...
2022-08-17    range4
2022-08-18    range4
2022-08-19    range4
2022-08-22    range4
2022-08-23    range4
Name: cut, Length: 5698, dtype: category
Categories (5, object): ['range1' < 'range2' < 'range3' < 'range4' < 'range5']
df['cut'].value_counts().sort_index().plot(kind='bar')
<AxesSubplot:>
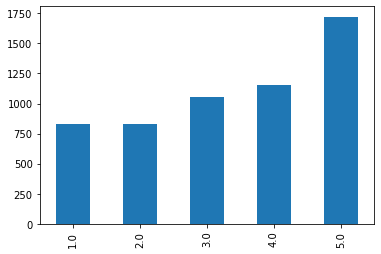
create 5 equal-distance bins with rolling and plot the bins (with bar chart)
df['roll_cut'] = df['Close'].rolling(100, 100).apply(lambda x: pd.cut(x, bins=5, labels = [i+1 for i in range(5)])[-1])
df['roll_cut'].value_counts().sort_index().plot(kind='bar')
<AxesSubplot:>
create 5 equal-distance bins with rolling, calculate the mean, and plot the bins (with bar chart)
df['roll_cut_mean'] = df['Close'].rolling(100, 100).apply(lambda x: x[pd.cut(x, bins=5, labels = [i+1 for i in range(5)])==1].mean())
df['roll_cut_mean'].value_counts().sort_index().plot(kind='bar')
<AxesSubplot:>
create 5 equal-distance bins on rolling normalized data with rolling cut and plot the bins (with bar chart)
df['roll_norm_close'] = df['Close'].rolling(100, 100).apply(lambda x: (x.mean()-x[-1])/x.std())
df[['Close', 'roll_norm_close']].plot(figsize=(14, 6), secondary_y = ['roll_norm_close'], grid=True)
df['roll_norm_close_cut'] = df['roll_norm_close'].rolling(100, 100).apply(lambda x: pd.cut(x, bins=5, labels = [i+1 for i in range(5)])[-1])
df['roll_norm_close_cut'].value_counts().sort_index().plot(kind='bar', title='roll_norm_close_cut')
df['Close'].plot(kind='hist', bins=5, title='Close')