Anomaly Detection with Salesforce Merlion Package - Unsupervised anomaly detection
Reference:
- github: https://github.com/salesforce/Merlion
Notes on installing Merlion:
- according to the github page,using
pip install salesforce-merlionshould be sufficient to have the Merlion package installed. - however, on Windows machine, an error can occur due to Merlion's dependency package
fbprophet. - in order to have merlion package be installed successfully, we need to first install
fbprophetpackage. This stack overflow page provides useful tricks to fix issues with installingfbprophetpackage on Windows machine. - what did not work for me: first run
pip install pystan==2.18.0.0, then runpip install fbprophet. - what worked for me:
- first run
pip install pystan==2.17.1.0. This step will uninstall whatever version of pystan package on the machine and isntall the version specified in the pip command. - then run
pip install fbprophet. This step will retrieve the latest pystan version, uninstall the version installed from previous step and install the latest version. The successfuly installation messageSuccessfully installed cmdstanpy-0.9.68 prophet-1.0.1 pystan-2.19.1.1.
- first run
Steps
- download market data using yfinance: download S&P 500 (‘^GSPC')
- calculate return 20 day max return (i.e. target in supervised learning problem):
- for each date (T):
- calculate the max price change in next 20 trading dates: price_change = (max{close price in T+1 to T+20} - {close price on T})/({close price on T})
- for each date (T):
- use Merlion to do unsupervised anomaly detection
- Initializing an anomaly detection model (including ensembles)
- Training the model
- Producing a series of anomaly scores with the model
import numpy as np
import pandas as pd
import statsmodels.api as sm

from datetime import datetime, timedelta
import yfinance as yf #to download stock price data
import matplotlib.pyplot as plt

from merlion.plot import plot_anoms
from merlion.utils import TimeSeries
np.random.seed(5678)
download S&P 500 price data
ticker = '^GSPC'
cur_data = yf.Ticker(ticker)
hist = cur_data.history(period="max")
print(ticker, hist.shape, hist.index.min())
^GSPC (19720, 7) 1927-12-30 00:00:00
df=hist[hist.index>='2000-01-01'].copy(deep=True)
df.head()
| Open | High | Low | Close | Volume | Dividends | Stock Splits | |
|---|---|---|---|---|---|---|---|
| Date | |||||||
| 2000-01-03 | 1469.250000 | 1478.000000 | 1438.359985 | 1455.219971 | 931800000 | 0 | 0 |
| 2000-01-04 | 1455.219971 | 1455.219971 | 1397.430054 | 1399.420044 | 1009000000 | 0 | 0 |
| 2000-01-05 | 1399.420044 | 1413.270020 | 1377.680054 | 1402.109985 | 1085500000 | 0 | 0 |
| 2000-01-06 | 1402.109985 | 1411.900024 | 1392.099976 | 1403.449951 | 1092300000 | 0 | 0 |
| 2000-01-07 | 1403.449951 | 1441.469971 | 1400.729980 | 1441.469971 | 1225200000 | 0 | 0 |
calcualte max return in next 20 trading days
#for each stock_id, get the max close in next 20 trading days
price_col = 'Close'
roll_len=20
new_col = 'next_20day_max'
target_list = []

df.sort_index(ascending=True, inplace=True)
df.head(3)
| Open | High | Low | Close | Volume | Dividends | Stock Splits | |
|---|---|---|---|---|---|---|---|
| Date | |||||||
| 2000-01-03 | 1469.250000 | 1478.000000 | 1438.359985 | 1455.219971 | 931800000 | 0 | 0 |
| 2000-01-04 | 1455.219971 | 1455.219971 | 1397.430054 | 1399.420044 | 1009000000 | 0 | 0 |
| 2000-01-05 | 1399.420044 | 1413.270020 | 1377.680054 | 1402.109985 | 1085500000 | 0 | 0 |
df_next20dmax=df[[price_col]].shift(1).rolling(roll_len).max()
df_next20dmax.columns=[new_col]
df = df.merge(df_next20dmax, right_index=True, left_index=True, how='inner')
df.dropna(how='any', inplace=True)
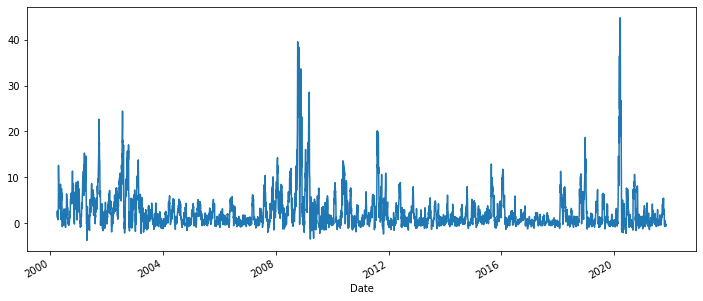
df['target']= 100*(df[new_col]-df[price_col])/df[price_col]
df.head(3)
| Open | High | Low | Close | Volume | Dividends | Stock Splits | next_20day_max_x | target | next_20day_max_y | next_20day_max | |
|---|---|---|---|---|---|---|---|---|---|---|---|
| Date | |||||||||||
| 2000-03-29 | 1507.729980 | 1521.449951 | 1497.449951 | 1508.520020 | 1061900000 | 0 | 0 | 1527.459961 | 1.255531 | 1527.459961 | 1527.459961 |
| 2000-03-30 | 1508.520020 | 1517.380005 | 1474.630005 | 1487.920044 | 1193400000 | 0 | 0 | 1527.459961 | 2.657395 | 1527.459961 | 1527.459961 |
| 2000-03-31 | 1487.920044 | 1519.810059 | 1484.380005 | 1498.579956 | 1227400000 | 0 | 0 | 1527.459961 | 1.927158 | 1527.459961 | 1527.459961 |
df['target'].plot.line(figsize=(12,5))
<AxesSubplot:xlabel='Date'>
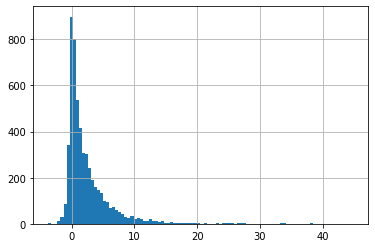
df['target'].hist(bins=100)
<AxesSubplot:>
Merlion: Anomaly detection - unsupervised with Isolation Forest
train_data = TimeSeries.from_pd(df[['target']].iloc[:-200])
test_data = TimeSeries.from_pd(df[['target']].iloc[-200:])
# Import models & configs
from merlion.models.anomaly.isolation_forest import IsolationForest, IsolationForestConfig


# isolation forest
iso_forest_config = IsolationForestConfig()
iso_forest_model  = IsolationForest(iso_forest_config)
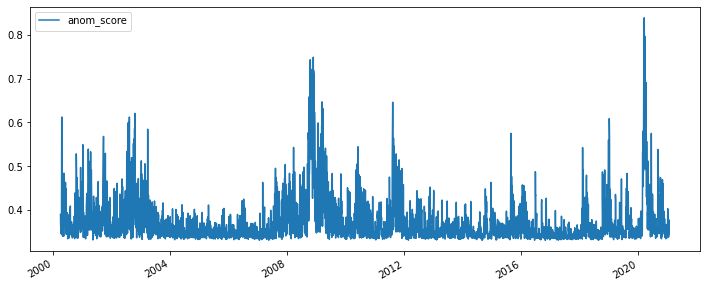
iso_forest_train_score = iso_forest_model.train(train_data=train_data, anomaly_labels=None)
iso_forest_train_score.to_pd().plot.line(figsize=(12,5))
<AxesSubplot:>
- Model Inference
- model.get_anomaly_score() returns the model's raw anomaly scores,
- model.get_anomaly_label() returns the model's post-processed anomaly scores. The post-processing calibrates the anomaly scores to be interpretable as z-scores, and it also sparsifies them such that any nonzero values should be treated as an alert that a particular timestamp is anomalous.
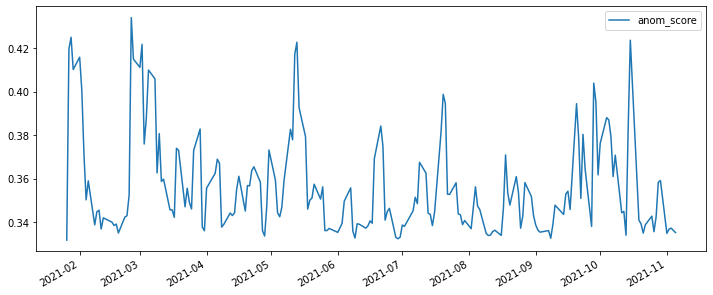
test_scores = iso_forest_model.get_anomaly_score(test_data)
test_scores_df = test_scores.to_pd()

test_labels = iso_forest_model.get_anomaly_label(test_data)
test_labels_df = test_labels.to_pd()
test_scores_df.plot.line(figsize=(12,5))
<AxesSubplot:>
test_labels_df.value_counts()
anom_score
0.0           199
dtype: int64