Data visualization and analysis handbook (Apr 2019 v2)
Examples of visualizations: 23. Waffle
Index
- Data visualization check list
- Chart selection
- Examples of visualizations
- Examples of makeovers – from bad to good
- How to develop a story with visualizations
- Resources
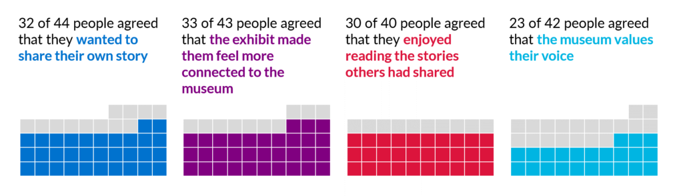
23. Waffle
Display part-to-whole patterns–a square version of a pie chart–with 100 miniature squares.
https://depictdatastudio.com/charts/waffle/
Example 1
Source: https://depictdatastudio.com/how-to-make-a-waffle-chart-in-microsoft-excel/
Example 2
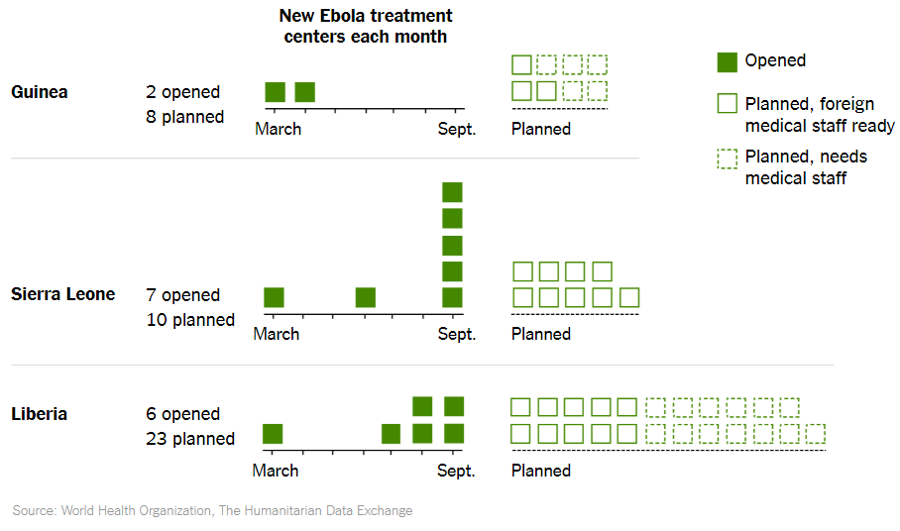
What Is Being Done to Improve Medical Treatment in Africa?
To stop the spread of Ebola, the World Health Organization is coordinating the construction and staffing of treatment centers across Liberia, Sierra Leone and Guinea. Those afflicted with the disease will have a higher chance of survival at a treatment center and will be less likely to infect others, officials said. As of October, there were 15 operational centers, with a total of 1,047 beds — but this is just a small fraction of the 41 new treatment centers that the W.H.O. has been trying to get into operation. The lack of infrastructure and of medical personnel make the construction and staffing of centers difficult.
Source: nytimes