Data visualization and analysis handbook (Apr 2019 v2)
Examples of visualizations: 9. Stacked Bar Chart
Index
- Data visualization check list
- Chart selection
- Examples of visualizations
- Examples of makeovers – from bad to good
- How to develop a story with visualizations
- Resources
9. Stacked Bar Chart
Stacked bar charts show how parts add up to a whole.
https://depictdatastudio.com/charts/stacked-bar/
Example 1
9% of US adults feel "very secure" about sharing info while making a call on their mobile phone
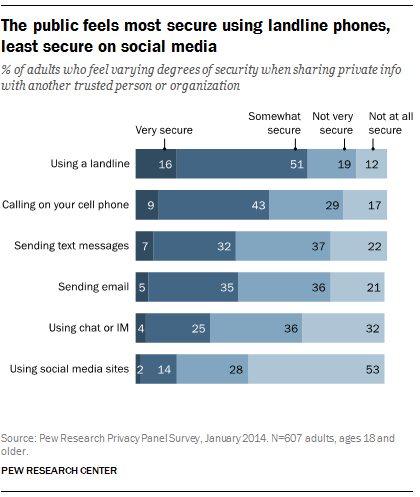
Source: pewresearch
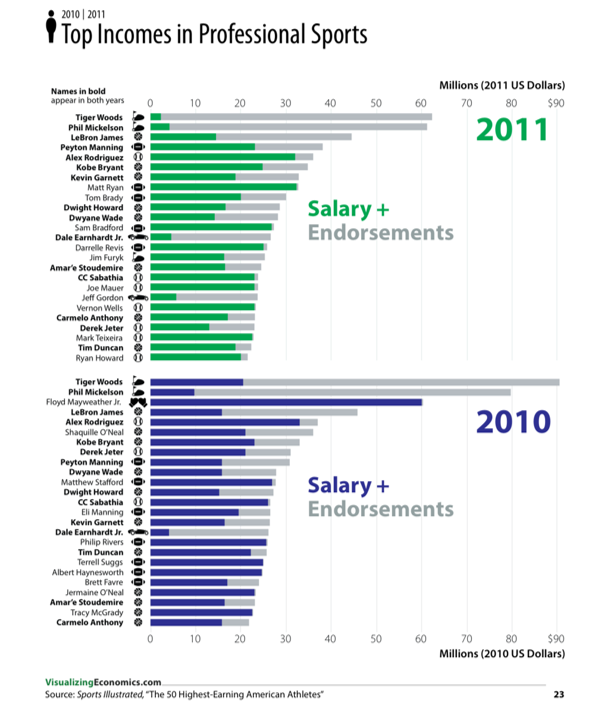
Example 2