Data visualization and analysis handbook (Apr 2019 v2)
Examples of visualizations: Stacked Area Chart
Index
- Data visualization check list
- Chart selection
- Examples of visualizations
- Examples of makeovers – from bad to good
- How to develop a story with visualizations
- Resources
3. Stacked Area Chart
Display part-to-whole patterns over time.
https://depictdatastudio.com/charts/stacked-area/
Example 1
Source:squarespace
Example 2
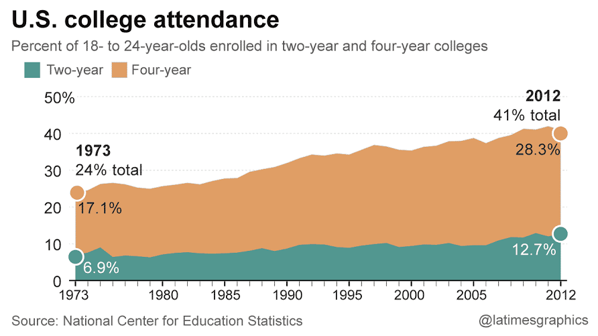
Obama wants community college to be free (or nearly) for anyone. Here's how much college costs have skyrocketed
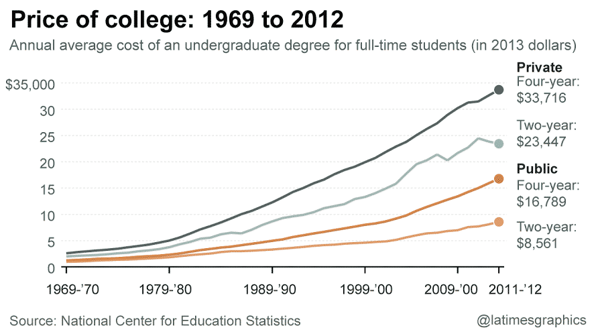
Additionally, people attending two- and four-year colleges have steadily risen
Source: twitter
Example 3
Measuring the Trump bump Donald Trump boosts the media exposure of his fellow heads of state, for better or worse
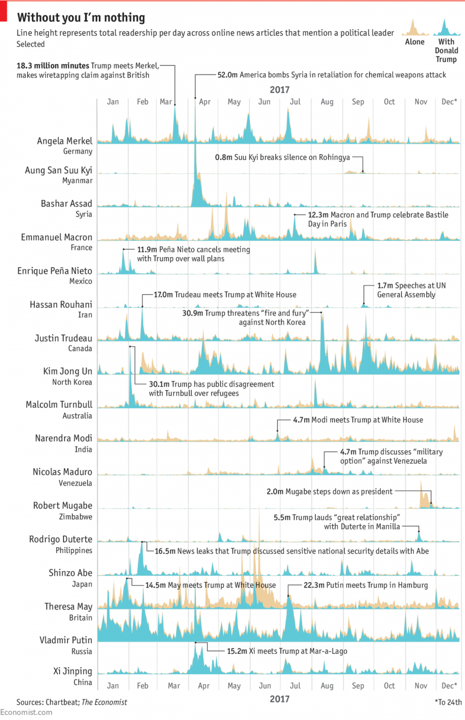
Source: economist
Example 4
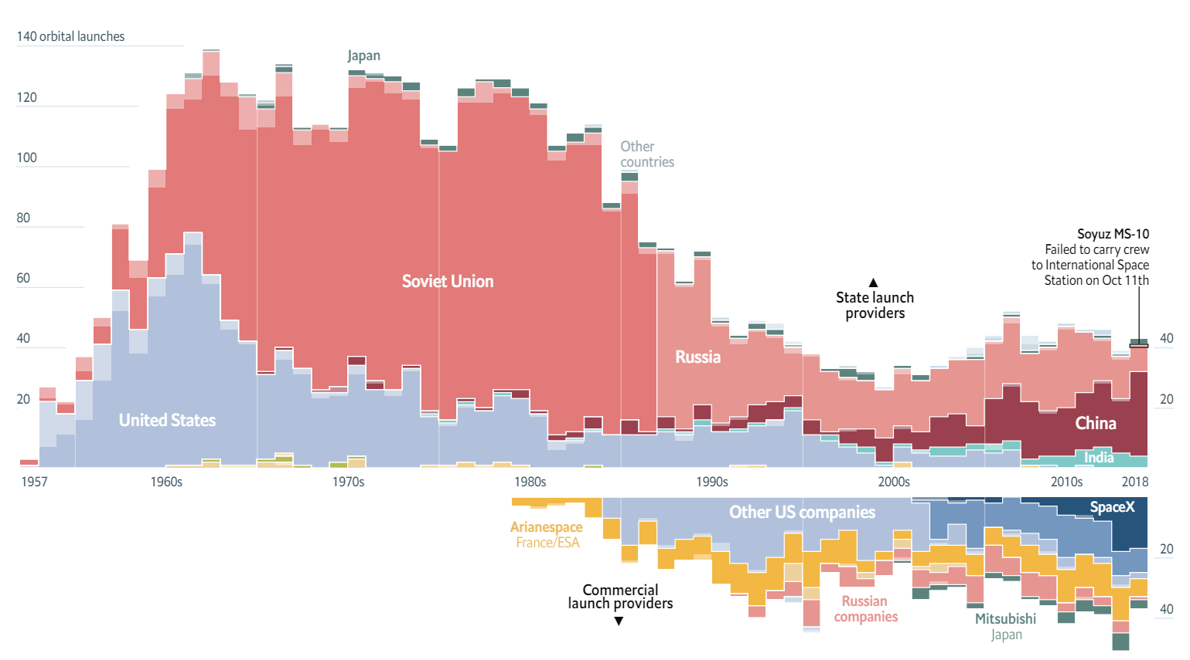
The space race is dominated by new contenders
Private businesses and rising powers are replacing the cold-war duopoly