Data visualization and analysis handbook (Apr 2019 v2)
Examples of visualizations: 2. Area Chart
Index
- Data visualization check list
- Chart selection
- Examples of visualizations
- Examples of makeovers – from bad to good
- How to develop a story with visualizations
- Resources
2. Area Chart
A great option when you only need to display a single line on the graph.
Area charts are like line charts with the area underneath the line shaded in. Line charts are a great option when you need to display two, three, or more series (lines) on a single graph. Area charts, on the other hand, are a great option when you only need to display a single line on the graph.
https://depictdatastudio.com/charts/area/
Example 1

Source:squarespace
Example 2
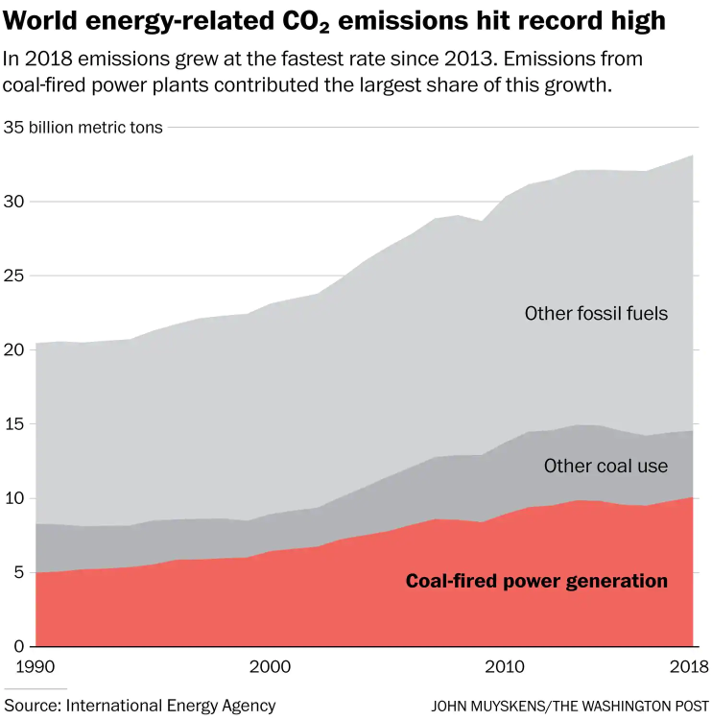
Source:washingtonpost
Example 3
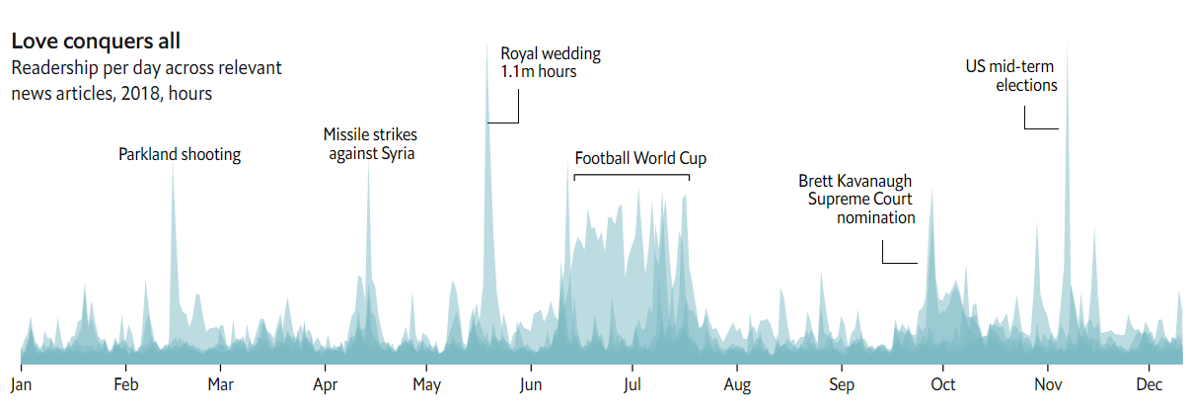
Source:economist
Example 4
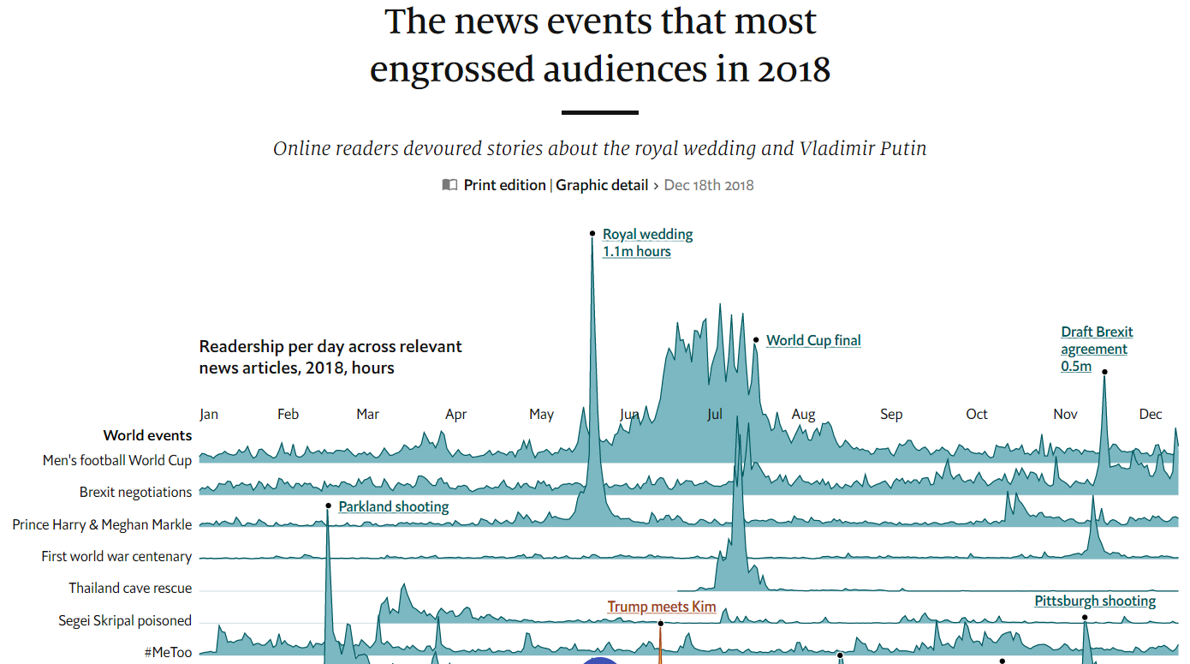
Source:economist
Example 5
All the president's tweets
Fox News enjoys considerable influence over the world's most important Twitter account
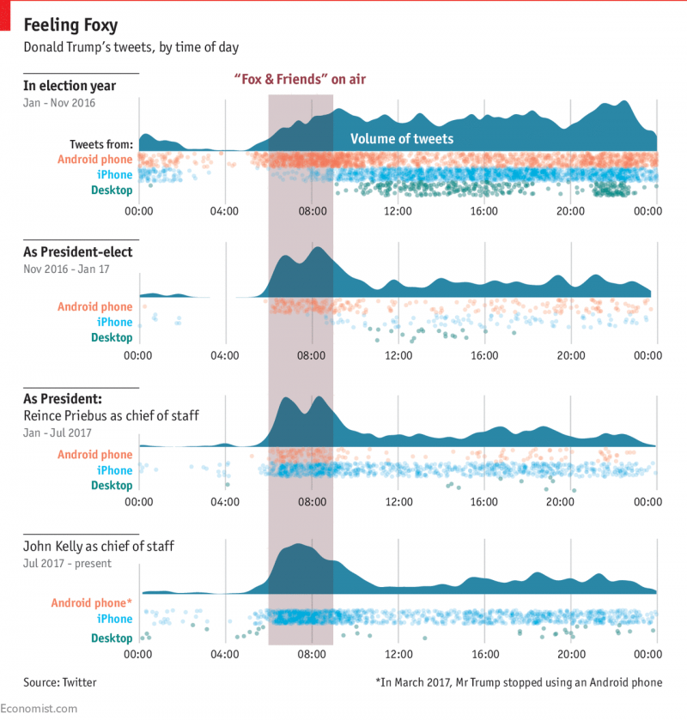
Source:economist