Data visualization and analysis handbook (Apr 2019 v2)
Examples of visualizations: 4. Slope Chart
Index
- Data visualization check list
- Chart selection
- Examples of visualizations
- Examples of makeovers – from bad to good
- How to develop a story with visualizations
- Resources
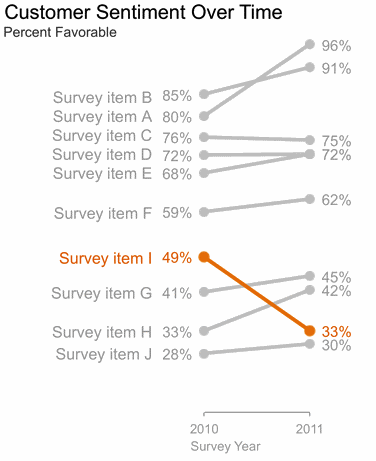
4. Slope Chart
A line graph that displays exactly two points in time.
Use slope graphs when there are only two points in time, or, there are zillions of points in time and want to focus attention on the bigger picture so that viewers don't get lost in the weeds. Slope charts can also be used to display rankings.
https://depictdatastudio.com/charts/slope/
Example 1
Source: http://www.storytellingwithdata.com/blog/2014/03/more-on-slopegraphs