Data visualization and analysis handbook (Apr 2019 v2)
Examples of visualizations: 12. Deviation Chart
Index
- Data visualization check list
- Chart selection
- Examples of visualizations
- Examples of makeovers – from bad to good
- How to develop a story with visualizations
- Resources
12. Deviation Chart
Display the differences between two things. In a deviation graph, you just display the differences between two things (rather than a traditional bar or column in which you graph the frequency or average).
https://depictdatastudio.com/charts/deviation-graph/
Example 1
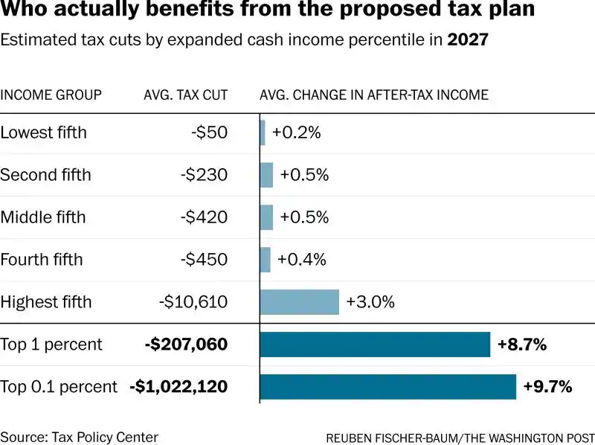
Source: washingtonpost
Example 2
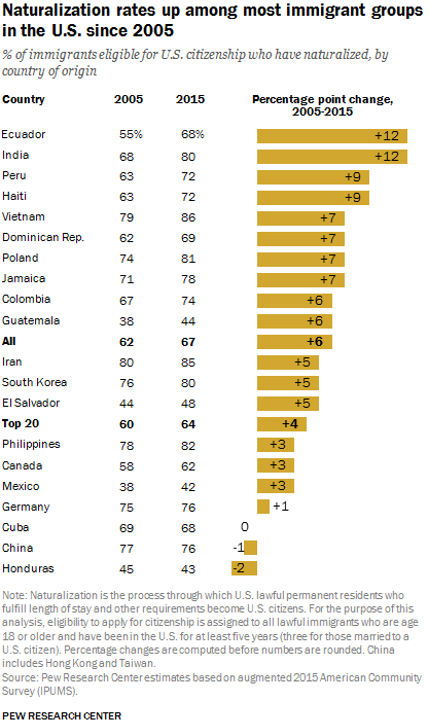
Source: pewresearch