Data visualization and analysis handbook (Apr 2019 v2)
Examples of visualizations: 11. Overlapping Bar Chart
Index
- Data visualization check list
- Chart selection
- Examples of visualizations
- Examples of makeovers – from bad to good
- How to develop a story with visualizations
- Resources
11. Overlapping Bar Chart
Visualize progress towards goals with overlapping bars. Use overlapping bars when every bar/column has a different goal. Use a target line when every bar/column has the same goal.
https://depictdatastudio.com/charts/overlapping-bars/
Example 1

Source: twitter
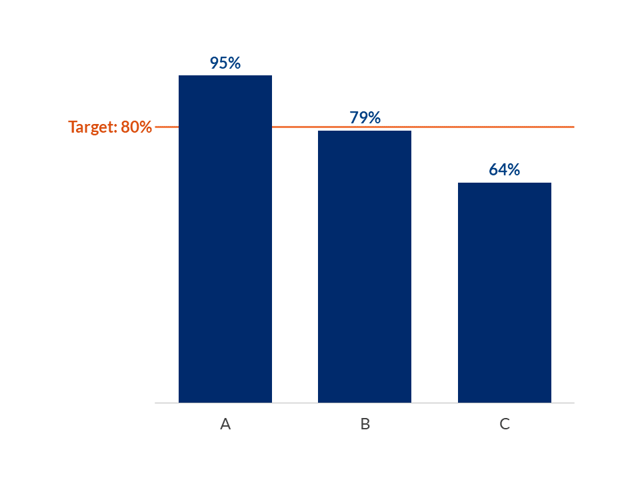
Target Lines on Bar Charts
Progress towards a goal. Visualize progress towards goals with a target line. Use a target line when every bar/column has the same goal. Use overlapping bars when every bar/column has a different goal.
Example 2
Source: https://depictdatastudio.com/charts/target-lines-on-bar-charts/
Example 3
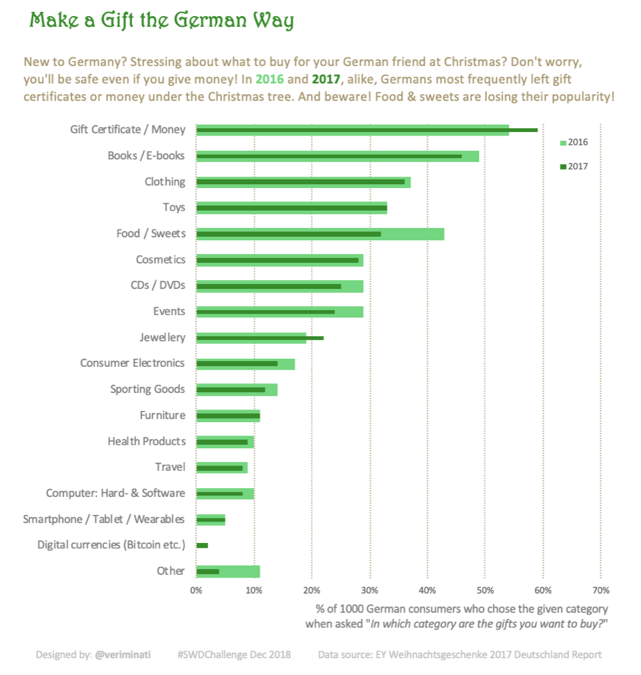 Source: http://www.storytellingwithdata.com/blog/2018/12/17/happy-holidays