Data visualization and analysis handbook (Apr 2019 v2)
Examples of visualizations: 21. Icon Array (Unit, Pictograph, Isotype)
Index
- Data visualization check list
- Chart selection
- Examples of visualizations
- Examples of makeovers – from bad to good
- How to develop a story with visualizations
- Resources
21. Icon Array (Unit, Pictograph, Isotype)
Each icon represents one unit of something, e.g., one person.
https://depictdatastudio.com/charts/icon-array/
Example 1
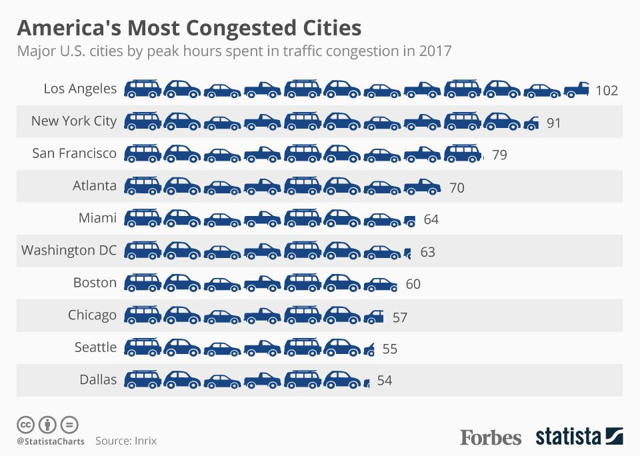
Source: forbes
Example 2
A new genetic-engineering technology could spell the end for malaria
In tests, a gene drive has already driven a small, caged mosquito population to extinction
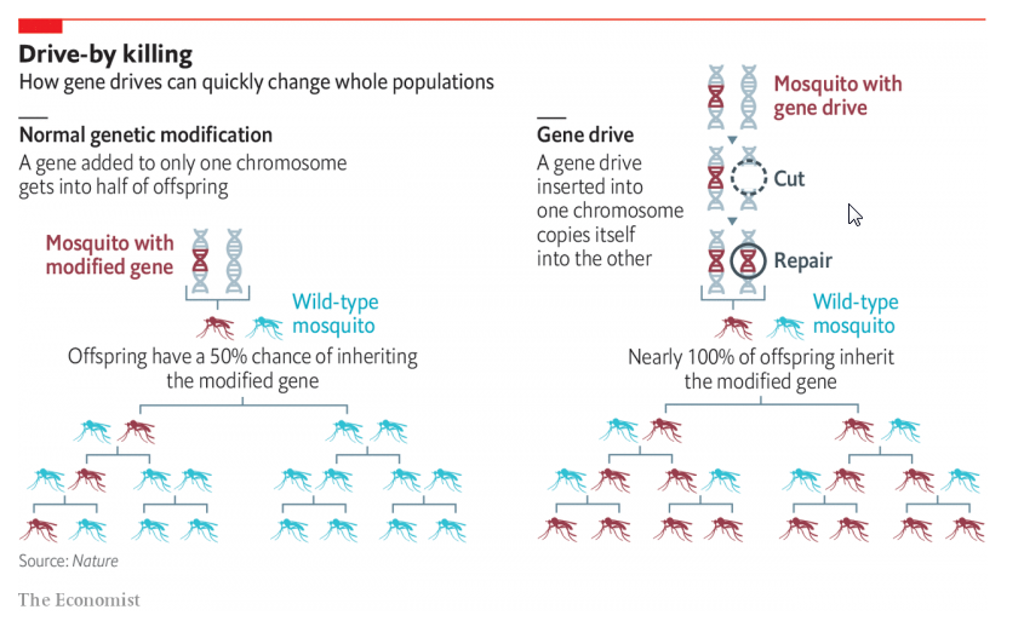
Source: economist