Data visualization and analysis handbook (Apr 2019 v2)
Examples of visualizations: 1. Line Chart – Estimations Chart, Target Lines
Index
- Data visualization check list
- Chart selection
- Examples of visualizations
- Examples of makeovers – from bad to good
- How to develop a story with visualizations
- Resources
1. Line Chart – Estimations Chart, Target Lines
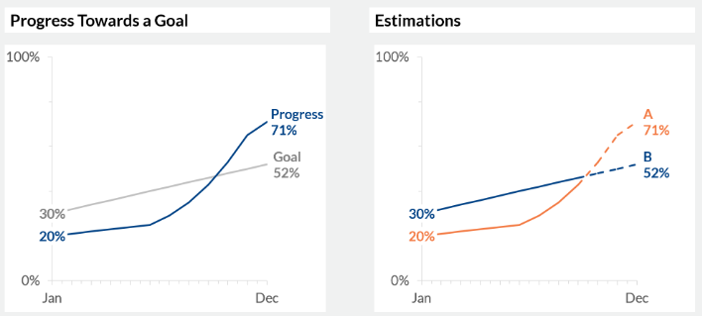
Target Lines on Line Charts
Visualize progress towards a goal over time by adding a light target line to your graph.
Source: https://depictdatastudio.com/charts/target-lines-on-line-charts/
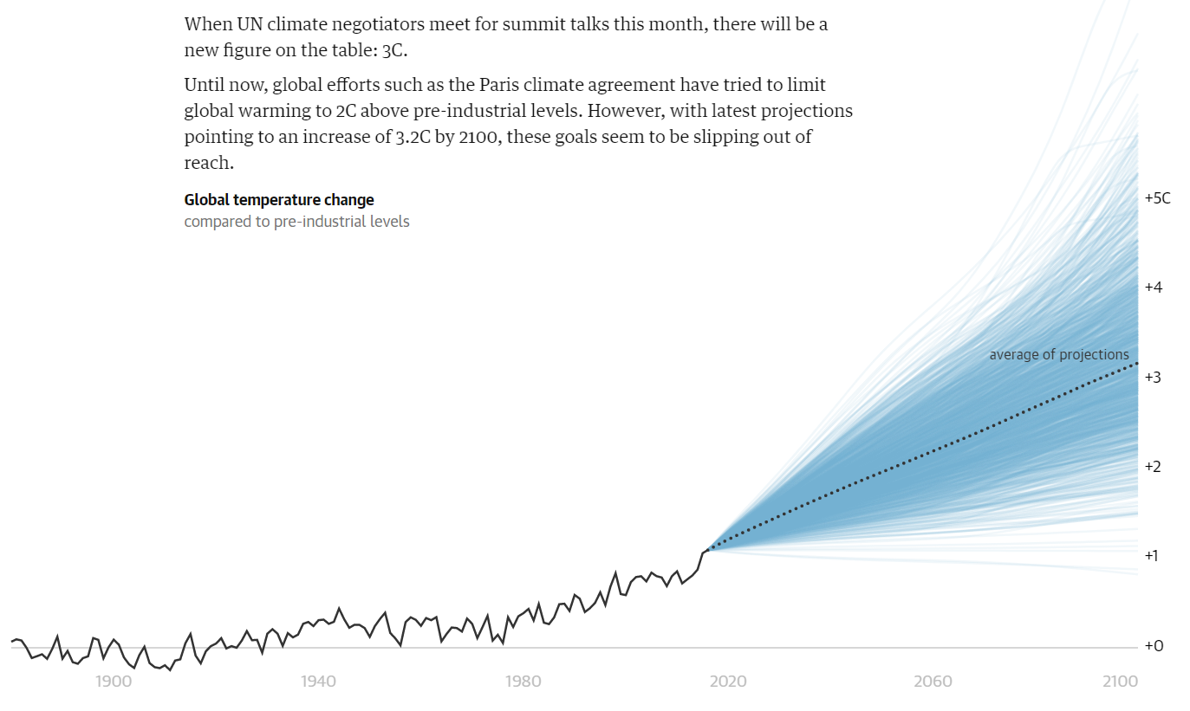
Estimations
Visualize estimations or projections with dotted lines.
Source: https://depictdatastudio.com/charts/estimations/
Example 1
Target Lines
Example 2