Data visualization and analysis handbook (Apr 2019 v2)
Examples of visualizations: 18. Boxplot
Index
- Data visualization check list
- Chart selection
- Examples of visualizations
- Examples of makeovers – from bad to good
- How to develop a story with visualizations
- Resources
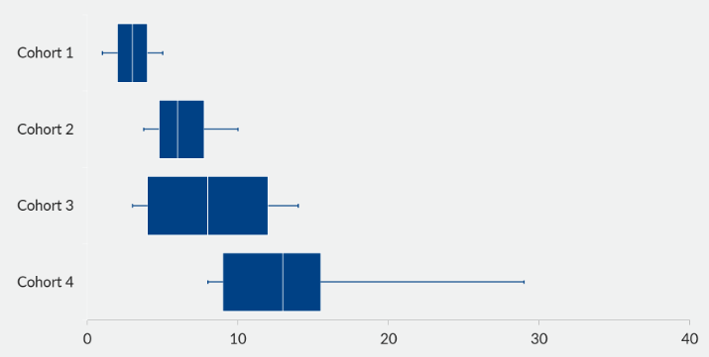
18. Boxplot
Box and Whisker Display the min, max, mean or median, and quartiles 1 and 3. Common in high school statistics courses, but not so common in the real world. These graphs display the min, max, mean or median, and quartiles 1 and 3.
https://depictdatastudio.com/charts/box-and-whisker/
Example 1
Source: peltiertech