Chande Momentum Oscillator (CMO)
References
Definition
- The Chande Momentum Oscillator is a technical momentum indicator and was designed specifically to track the movement and momentum of a security. The oscillator calculates the difference between the sum of both recent gains and recent losses, then dividing the result by the sum of all price movement over the same period (usually defined as 20 periods).
- it is developed by Tushar Chande.
Calculation
CMO = 100 * ((Su - Sd)/ ( Su + Sd ) )
- Su = Sum of the difference between the current close and previous close on up days for the specified period. Up days are days when the current close is greater than the previous close.
- Sd = Sum of the absolute value of the difference between the current close and the previous close on down days for the specified period. Down days are days when the current close is less than the previous close.
Read the indicator
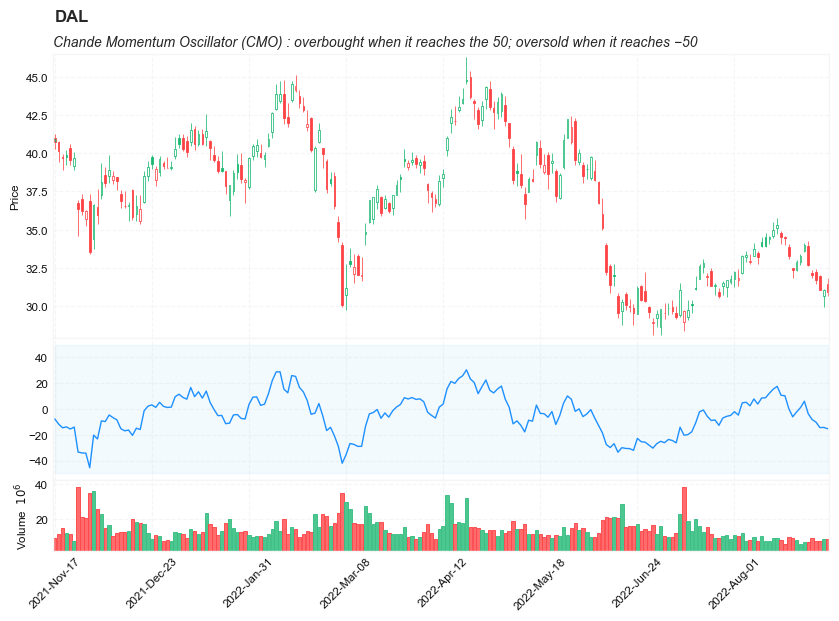
- CMO indicates overbought conditions when it reaches the 50 level and oversold conditions when it reaches −50. You can also look for signals based on the CMO crossing above and below a signal line composed of a 9-period moving average of the 20 period CMO.
- CMO measures the trend strength. The higher the absolute value of the CMO, the stronger the trend. Lower absolute values of the CMO indicate sideways trading ranges.
- CMO often forms chart patterns which may not show on the underlying price chart, such as double tops and bottoms and trend lines. Also look for support or resistance on the CMO.
- If underlying prices make a new high or low that is not confirmed by the CMO, the divergence can signal a price reversal.
Load basic packages
import pandas as pd
import numpy as np
import os
import gc
import copy
from pathlib import Path
from datetime import datetime, timedelta, time, date
#this package is to download equity price data from yahoo finance
#the source code of this package can be found here: https://github.com/ranaroussi/yfinance/blob/main
import yfinance as yf
pd.options.display.max_rows = 100
pd.options.display.max_columns = 100

import warnings
warnings.filterwarnings("ignore")

import pytorch_lightning as pl
random_seed=1234
pl.seed_everything(random_seed)
Global seed set to 1234


1234
#S&P 500 (^GSPC),  Dow Jones Industrial Average (^DJI), NASDAQ Composite (^IXIC)
#Russell 2000 (^RUT), Crude Oil Nov 21 (CL=F), Gold Dec 21 (GC=F)
#Treasury Yield 10 Years (^TNX)

#benchmark_tickers = ['^GSPC', '^DJI', '^IXIC', '^RUT',  'CL=F', 'GC=F', '^TNX']

benchmark_tickers = ['^GSPC']
tickers = benchmark_tickers + ['GSK', 'NVO', 'PFE', 'DAL']
#https://github.com/ranaroussi/yfinance/blob/main/yfinance/base.py
#     def history(self, period="1mo", interval="1d",
#                 start=None, end=None, prepost=False, actions=True,
#                 auto_adjust=True, back_adjust=False,
#                 proxy=None, rounding=False, tz=None, timeout=None, **kwargs):

dfs = {}

for ticker in tickers:
    cur_data = yf.Ticker(ticker)
    hist = cur_data.history(period="max", start='2000-01-01')
    print(datetime.now(), ticker, hist.shape, hist.index.min(), hist.index.max())
    dfs[ticker] = hist
2022-09-05 18:49:35.187257 ^GSPC (5706, 7) 1999-12-31 00:00:00 2022-09-02 00:00:00
2022-09-05 18:49:35.486509 GSK (5706, 7) 1999-12-31 00:00:00 2022-09-02 00:00:00
2022-09-05 18:49:35.808997 NVO (5706, 7) 1999-12-31 00:00:00 2022-09-02 00:00:00
2022-09-05 18:49:36.178256 PFE (5706, 7) 1999-12-31 00:00:00 2022-09-02 00:00:00
2022-09-05 18:49:36.477842 DAL (3863, 7) 2007-05-03 00:00:00 2022-09-02 00:00:00
ticker = 'DAL'
dfs[ticker].tail(5)
| Open | High | Low | Close | Volume | Dividends | Stock Splits | |
|---|---|---|---|---|---|---|---|
| Date | |||||||
| 2022-08-29 | 32.200001 | 32.349998 | 31.850000 | 32.029999 | 8758400 | 0.0 | 0 |
| 2022-08-30 | 32.250000 | 32.450001 | 31.469999 | 31.719999 | 7506400 | 0.0 | 0 |
| 2022-08-31 | 31.969999 | 32.020000 | 31.059999 | 31.070000 | 7450000 | 0.0 | 0 |
| 2022-09-01 | 30.650000 | 31.139999 | 29.940001 | 31.090000 | 8572700 | 0.0 | 0 |
| 2022-09-02 | 31.440001 | 31.830000 | 30.700001 | 30.940001 | 8626500 | 0.0 | 0 |
Define Chande Momentum Oscillator (CMO) calculation function
def cal_cmo(ohlc: pd.DataFrame, period: int = 9, factor: int = 100,
            column: str = "close", adjust: bool = True) -> pd. DataFrame:
    """
    Chande Momentum Oscillator (CMO) - technical momentum indicator invented by the technical analyst Tushar Chande.
    It is created by calculating the difference between the sum of all recent gains and the sum of all recent losses and then
    dividing the result by the sum of all price movement over the period.
    This oscillator is similar to other momentum indicators such as the Relative Strength Index and the Stochastic Oscillator
    because it is range bounded (+100 and -100).

    """

    # get the price diff
    delta = ohlc[column].diff()

    # positive gains (up) and negative gains (down) Series
    up, down = delta.copy(), delta.copy()
    up[up < 0] = 0
    down[down > 0] = 0

    # EMAs of ups and downs
    _gain = up.ewm(com=period, adjust=adjust).mean()
    _loss = down.ewm(com=period, adjust=adjust).mean().abs()

    return pd.Series(factor * ((_gain - _loss) / (_gain + _loss)), name=f"CMO{period}")
Calculate Chande Momentum Oscillator (CMO)
df = dfs[ticker][['Open', 'High', 'Low', 'Close', 'Volume']]
df = df.round(2)
cal_cmo
<function __main__.cal_cmo(ohlc: pandas.core.frame.DataFrame, period: int = 9, factor: int = 100, column: str = 'close', adjust: bool = True) -> pandas.core.frame.DataFrame>
df_ta = cal_cmo(df, period=20, column='Close')
df = df.merge(df_ta, left_index = True, right_index = True, how='inner' )

del df_ta
gc.collect()
122
display(df.head(5))
display(df.tail(5))
| Open | High | Low | Close | Volume | CMO20 | |
|---|---|---|---|---|---|---|
| Date | ||||||
| 2007-05-03 | 19.32 | 19.50 | 18.25 | 18.40 | 8052800 | NaN |
| 2007-05-04 | 18.88 | 18.96 | 18.39 | 18.64 | 5437300 | 100.000000 |
| 2007-05-07 | 18.83 | 18.91 | 17.94 | 18.08 | 2646300 | -42.028986 |
| 2007-05-08 | 17.76 | 17.76 | 17.14 | 17.44 | 4166100 | -68.701095 |
| 2007-05-09 | 17.54 | 17.94 | 17.44 | 17.58 | 7541100 | -52.577082 |
| Open | High | Low | Close | Volume | CMO20 | |
|---|---|---|---|---|---|---|
| Date | ||||||
| 2022-08-29 | 32.20 | 32.35 | 31.85 | 32.03 | 8758400 | -8.167015 |
| 2022-08-30 | 32.25 | 32.45 | 31.47 | 31.72 | 7506400 | -10.230043 |
| 2022-08-31 | 31.97 | 32.02 | 31.06 | 31.07 | 7450000 | -14.460750 |
| 2022-09-01 | 30.65 | 31.14 | 29.94 | 31.09 | 8572700 | -14.286736 |
| 2022-09-02 | 31.44 | 31.83 | 30.70 | 30.94 | 8626500 | -15.300781 |
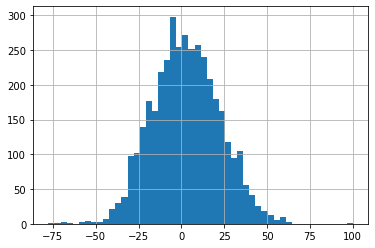
df['CMO20'].hist(bins=50)
<AxesSubplot:>
#https://github.com/matplotlib/mplfinance
#this package help visualize financial data
import mplfinance as mpf
import matplotlib.colors as mcolors

# all_colors = list(mcolors.CSS4_COLORS.keys())#"CSS Colors"
# all_colors = list(mcolors.TABLEAU_COLORS.keys()) # "Tableau Palette",
all_colors = ['dodgerblue', 'firebrick','limegreen','skyblue','lightgreen',  'navy','yellow','plum',  'yellowgreen']
# all_colors = list(mcolors.BASE_COLORS.keys()) #"Base Colors",


#https://github.com/matplotlib/mplfinance/issues/181#issuecomment-667252575
#list of colors: https://matplotlib.org/stable/gallery/color/named_colors.html
#https://github.com/matplotlib/mplfinance/blob/master/examples/styles.ipynb

def make_3panels2(main_data, mid_panel, chart_type='candle', names=None,
                  figratio=(14,9), fill_weights = (0, 0)):
    """
    main chart type: default is candle. alternatives: ohlc, line

    example:
    start = 200

    names = {'main_title': 'MAMA: MESA Adaptive Moving Average',
             'sub_tile': 'S&P 500 (^GSPC)', 'y_tiles': ['price', 'Volume [$10^{6}$]']}


    make_candle(df.iloc[-start:, :5], df.iloc[-start:][['MAMA', 'FAMA']], names = names)

    """

    style = mpf.make_mpf_style(base_mpf_style='yahoo',  #charles
                               base_mpl_style = 'seaborn-whitegrid',
#                                marketcolors=mpf.make_marketcolors(up="r", down="#0000CC",inherit=True),
                               gridcolor="whitesmoke",
                               gridstyle="--", #or None, or - for solid
                               gridaxis="both",
                               edgecolor = 'whitesmoke',
                               facecolor = 'white', #background color within the graph edge
                               figcolor = 'white', #background color outside of the graph edge
                               y_on_right = False,
                               rc =  {'legend.fontsize': 'small',#or number
                                      #'figure.figsize': (14, 9),
                                     'axes.labelsize': 'small',
                                     'axes.titlesize':'small',
                                     'xtick.labelsize':'small',#'x-small', 'small','medium','large'
                                     'ytick.labelsize':'small'
                                     },
                              )

    if (chart_type is None) or (chart_type not in ['ohlc', 'line', 'candle', 'hollow_and_filled']):
        chart_type = 'candle'
    len_dict = {'candle':2, 'ohlc':3, 'line':1, 'hollow_and_filled':2}

    kwargs = dict(type=chart_type, figratio=figratio, volume=True, volume_panel=2,
                  panel_ratios=(4,2,1), tight_layout=True, style=style, returnfig=True)

    if names is None:
        names = {'main_title': '', 'sub_tile': ''}


    added_plots = { }

    fb_bbands2_ = dict(y1=fill_weights[0]*np.ones(mid_panel.shape[0]),
                      y2=fill_weights[1]*np.ones(mid_panel.shape[0]),color="lightskyblue",alpha=0.1,interpolate=True)
    fb_bbands2_['panel'] = 1

    fb_bbands= [fb_bbands2_]


    i = 0
    for name_, data_ in mid_panel.iteritems():
        added_plots[name_] = mpf.make_addplot(data_, panel=1, width=1, color=all_colors[i], secondary_y=False)
        i = i + 1


    fig, axes = mpf.plot(main_data,  **kwargs,
                         addplot=list(added_plots.values()),
                         fill_between=fb_bbands)
    # add a new suptitle
    fig.suptitle(names['main_title'], y=1.05, fontsize=12, x=0.1285)

    axes[0].set_title(names['sub_tile'], fontsize=10, style='italic',  loc='left')
#     axes[2].set_ylabel('WAVEPM10')

#     axes[0].set_ylabel(names['y_tiles'][0])
#     axes[2].set_ylabel(names['y_tiles'][1])
    return fig, axes
start = -200
end = df.shape[0]

names = {'main_title': f'{ticker}',
         'sub_tile': 'Chande Momentum Oscillator (CMO) : overbought when it reaches the 50; oversold when it reaches −50'}


aa_, bb_ = make_3panels2(df.iloc[start:end][['Open', 'High', 'Low', 'Close', 'Volume']],
             df.iloc[start:end][['CMO20']],
             chart_type='hollow_and_filled',names = names,
                         fill_weights = (-50, 50))