Data visualization and analysis handbook (Apr 2019 v2)
Examples of visualizations: 16. Dumbbell (Connected) Dot Chart
Index
- Data visualization check list
- Chart selection
- Examples of visualizations
- Examples of makeovers – from bad to good
- How to develop a story with visualizations
- Resources
16. Dumbbell (Connected) Dot Chart
Dumbbell dot plots — dot plots with two or more series of data — are an alternative to the clustered bar chart or slope graph. Use dot plots to visualize two or three different points in time. Or, use them to triangulate different viewpoints (e.g., one dot for Republicans and another dot for Democrats, or one dot for principals and another dot for teachers).
https://depictdatastudio.com/charts/dumbbell-dot/
Example 1
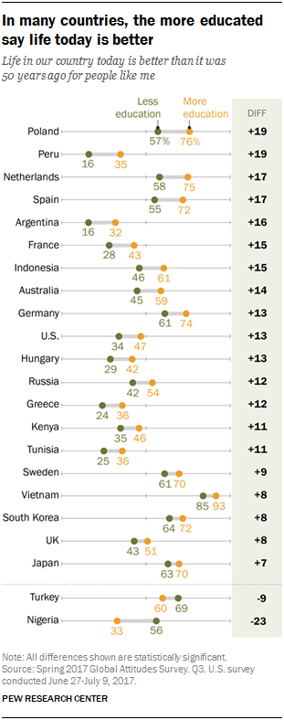
Source: pewglobal
Example 2
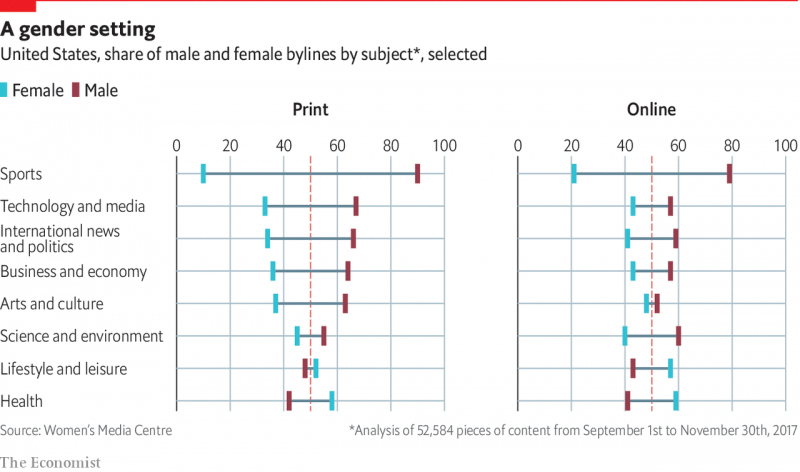
Source: economist
Example 3
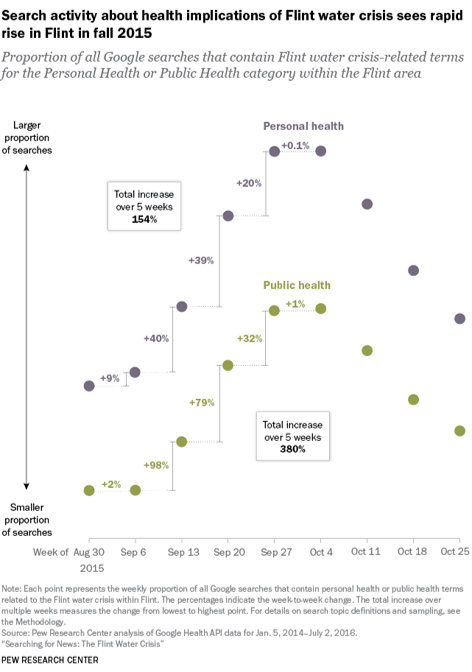
Source: journalism