Short-Term Continuation And Reversal Signals: DMI Continuation Signals and CCI Reversal Signals
References
█ OVERVIEW
In her article in December 2022 Traders' Tips, "Short-Term Continuation And Reversal Signals," author Barbara Star describes modifications to the classic directional movement indicator (DMI) and commodity channel index (CCI) that can aid in more easily identifying price reversals and continuations in a trend. Traditionally, the DMI is comprised of two lines: a plus line (+DI) and negative line (−DI).
In her article, Star creates a DMI oscillator by subtracting −DI from +DI. Historically, the DMI uses a default length of 14. In the article, this has been shortened to 10. The CCI has also been adjusted in the article to use a length of 13 instead of the usual 14 or 20. The DMI oscillator PaintBar colors the price bars so they match the color of the DMI oscillator. Here, CCI reversal signals are plotted with crosses (plus signs) as opposed to the diamond shapes used by the author.
█ STRATEGY
DMI oscillator continuation signals:
BUY LONG CONDITIONS: [All of which must be true]

     A>B(Close,Avg(Close,18))
     A>B(PlusDI(High,Low,Close,10),MinusDI(High,Low,Close,10))
     A>B(Low,Lag(Low,1))
     A<B(Lag(Low,1),Lag(Low,2))


SELL LONG CONDITIONS: [All of which must be true]

     A<B(Close,Avg(Close,18))
     A<B(PlusDI(High,Low,Close,10),MinusDI(High,Low,Close,10))
     A<B(High,Lag(High,1))
     A>B(Lag(High,1),Lag(High,2))
CCI reversal signals:
BUY LONG CONDITIONS: [All of which must be true]

     A>=B(CCI(High,Low,Close,13,0.015),-100)
     A<B(Lag(CCI(High,Low,Close,13,0.015),1),-100)
     A<B(Lag(CCI(High,Low,Close,13,0.015),2),-100)

SELL LONG CONDITIONS: [All of which must be true]

     A<=B(CCI(High,Low,Close,13,0.015),100)
     A>B(Lag(CCI(High,Low,Close,13,0.015),1),100)
     A>B(Lag(CCI(High,Low,Close,13,0.015),2),100)
Load basic packages
import pandas as pd
import numpy as np
import os
import gc
import copy
from pathlib import Path
from datetime import datetime, timedelta, time, date
#!pip install yfinance
#!pip install mplfinance
#this package is to download equity price data from yahoo finance
#the source code of this package can be found here: https://github.com/ranaroussi/yfinance/blob/main
import yfinance as yf
pd.options.display.max_rows = 100
pd.options.display.max_columns = 100

import warnings
warnings.filterwarnings("ignore")

import pytorch_lightning as pl
random_seed=1234
pl.seed_everything(random_seed)
1234
Download data
#S&P 500 (^GSPC),  Dow Jones Industrial Average (^DJI), NASDAQ Composite (^IXIC)
#Russell 2000 (^RUT), Crude Oil Nov 21 (CL=F), Gold Dec 21 (GC=F)
#Treasury Yield 10 Years (^TNX)
#CBOE Volatility Index (^VIX) Chicago Options - Chicago Options Delayed Price. Currency in USD

#benchmark_tickers = ['^GSPC', '^DJI', '^IXIC', '^RUT',  'CL=F', 'GC=F', '^TNX']

benchmark_tickers = ['^GSPC', '^VIX']
tickers = benchmark_tickers + ['GSK', 'BST', 'PFE']
#https://github.com/ranaroussi/yfinance/blob/main/yfinance/base.py
#     def history(self, period="1mo", interval="1d",
#                 start=None, end=None, prepost=False, actions=True,
#                 auto_adjust=True, back_adjust=False,
#                 proxy=None, rounding=False, tz=None, timeout=None, **kwargs):

dfs = {}

for ticker in tickers:
    cur_data = yf.Ticker(ticker)
    hist = cur_data.history(period="max", start='2000-01-01')
    print(f"{datetime.now()}\t {ticker}\t {hist.shape}\t {hist.index.min()}\t {hist.index.max()}")
    dfs[ticker] = hist
2023-03-05 11:37:13.415477	 ^GSPC	 (5829, 7)	 2000-01-03 00:00:00-05:00	 2023-03-03 00:00:00-05:00
2023-03-05 11:37:14.331050	 ^VIX	 (5829, 7)	 2000-01-03 00:00:00-05:00	 2023-03-03 00:00:00-05:00
2023-03-05 11:37:15.334950	 GSK	 (5829, 7)	 2000-01-03 00:00:00-05:00	 2023-03-03 00:00:00-05:00
2023-03-05 11:37:16.169901	 BST	 (2100, 7)	 2014-10-29 00:00:00-04:00	 2023-03-03 00:00:00-05:00
2023-03-05 11:37:17.207059	 PFE	 (5829, 7)	 2000-01-03 00:00:00-05:00	 2023-03-03 00:00:00-05:00
ticker = '^GSPC'
dfs[ticker].tail(5)
| Open | High | Low | Close | Volume | Dividends | Stock Splits | |
|---|---|---|---|---|---|---|---|
| Date | |||||||
| 2023-02-27 00:00:00-05:00 | 3992.360107 | 4018.050049 | 3973.550049 | 3982.239990 | 3836950000 | 0.0 | 0.0 |
| 2023-02-28 00:00:00-05:00 | 3977.189941 | 3997.500000 | 3968.979980 | 3970.149902 | 5043400000 | 0.0 | 0.0 |
| 2023-03-01 00:00:00-05:00 | 3963.340088 | 3971.729980 | 3939.050049 | 3951.389893 | 4249480000 | 0.0 | 0.0 |
| 2023-03-02 00:00:00-05:00 | 3938.679932 | 3990.840088 | 3928.159912 | 3981.350098 | 4244900000 | 0.0 | 0.0 |
| 2023-03-03 00:00:00-05:00 | 3998.020020 | 4048.290039 | 3995.169922 | 4045.639893 | 4084730000 | 0.0 | 0.0 |
Calculate
import sys
sys.path.append(r"/kaggle/input/technical-indicators-core")
#from core.finta import TA
from finta import TA
df = dfs[ticker][['Open', 'High', 'Low', 'Close', 'Volume']]
df = df.round(2)
#help(TA.DMI)
df_ta = TA.DMI(df, period = 10)
df = df.merge(df_ta, left_index = True, right_index = True, how='inner' )

del df_ta
gc.collect()
5689
df.tail(5)
| Open | High | Low | Close | Volume | DI_PLUS | DI_MINUS | |
|---|---|---|---|---|---|---|---|
| Date | |||||||
| 2023-02-27 00:00:00-05:00 | 3992.36 | 4018.05 | 3973.55 | 3982.24 | 3836950000 | 22.890861 | 25.460095 |
| 2023-02-28 00:00:00-05:00 | 3977.19 | 3997.50 | 3968.98 | 3970.15 | 5043400000 | 20.601775 | 23.762409 |
| 2023-03-01 00:00:00-05:00 | 3963.34 | 3971.73 | 3939.05 | 3951.39 | 4249480000 | 18.541597 | 27.293832 |
| 2023-03-02 00:00:00-05:00 | 3938.68 | 3990.84 | 3928.16 | 3981.35 | 4244900000 | 20.326190 | 24.564449 |
| 2023-03-03 00:00:00-05:00 | 3998.02 | 4048.29 | 3995.17 | 4045.64 | 4084730000 | 29.051796 | 22.108004 |
#help(TA.SMA)
df['SMA'] = TA.SMA(df, period=18, column='close')
df.tail(5)
| Open | High | Low | Close | Volume | DI_PLUS | DI_MINUS | SMA | |
|---|---|---|---|---|---|---|---|---|
| Date | ||||||||
| 2023-02-27 00:00:00-05:00 | 3992.36 | 4018.05 | 3973.55 | 3982.24 | 3836950000 | 22.890861 | 25.460095 | 4085.770000 |
| 2023-02-28 00:00:00-05:00 | 3977.19 | 3997.50 | 3968.98 | 3970.15 | 5043400000 | 20.601775 | 23.762409 | 4077.488889 |
| 2023-03-01 00:00:00-05:00 | 3963.34 | 3971.73 | 3939.05 | 3951.39 | 4249480000 | 18.541597 | 27.293832 | 4064.801667 |
| 2023-03-02 00:00:00-05:00 | 3938.68 | 3990.84 | 3928.16 | 3981.35 | 4244900000 | 20.326190 | 24.564449 | 4056.183333 |
| 2023-03-03 00:00:00-05:00 | 3998.02 | 4048.29 | 3995.17 | 4045.64 | 4084730000 | 29.051796 | 22.108004 | 4052.547778 |
#help(TA.CCI)
df['CCI'] = TA.CCI(df, period=13)
#DMIOsc = oDMIPlus - oDMIMinus;
df['DMI_OSC']  = df['DI_PLUS'] - df['DI_MINUS']
#df['PRE_CLOSE'] = df['Close'].shift(1)
# df['PRE_Low'] = df['Low'].shift(1)
# df['PRE_Low2'] = df['Low'].shift(2)
# df['PRE_High'] = df['High'].shift(1)
# df['PRE_High2'] = df['High'].shift(2)

# df['PRE_CCI'] = df['CCI'].shift(1)
# df['PRE_CCI2'] = df['CCI'].shift(2)
df.tail(5)
| Open | High | Low | Close | Volume | DI_PLUS | DI_MINUS | SMA | CCI | DMI_OSC | |
|---|---|---|---|---|---|---|---|---|---|---|
| Date | ||||||||||
| 2023-02-27 00:00:00-05:00 | 3992.36 | 4018.05 | 3973.55 | 3982.24 | 3836950000 | 22.890861 | 25.460095 | 4085.770000 | -89.591020 | -2.569235 |
| 2023-02-28 00:00:00-05:00 | 3977.19 | 3997.50 | 3968.98 | 3970.15 | 5043400000 | 20.601775 | 23.762409 | 4077.488889 | -86.569991 | -3.160634 |
| 2023-03-01 00:00:00-05:00 | 3963.34 | 3971.73 | 3939.05 | 3951.39 | 4249480000 | 18.541597 | 27.293832 | 4064.801667 | -97.115958 | -8.752235 |
| 2023-03-02 00:00:00-05:00 | 3938.68 | 3990.84 | 3928.16 | 3981.35 | 4244900000 | 20.326190 | 24.564449 | 4056.183333 | -72.464634 | -4.238259 |
| 2023-03-03 00:00:00-05:00 | 3998.02 | 4048.29 | 3995.17 | 4045.64 | 4084730000 | 29.051796 | 22.108004 | 4052.547778 | 4.893484 | 6.943792 |
DMI oscillator continuation signals:
BUY LONG CONDITIONS: [All of which must be true]

     A>B(Close,Avg(Close,18))
     A>B(PlusDI(High,Low,Close,10),MinusDI(High,Low,Close,10))
     A>B(Low,Lag(Low,1))
     A<B(Lag(Low,1),Lag(Low,2))
df['DMI_BUY'] = 0
buy_cond = (df['Close']>df['SMA'])
buy_cond = buy_cond & (df['DI_PLUS'] > df['DI_MINUS'])
buy_cond = buy_cond & (df['Low'] > (df['Low'].shift(1)))
buy_cond = buy_cond & ((df['Low'].shift(1)) < (df['Low'].shift(2)))
df.loc[buy_cond, 'DMI_BUY'] = 1
DMI oscillator continuation signals:
SELL LONG CONDITIONS: [All of which must be true]

     A<B(Close,Avg(Close,18))
     A<B(PlusDI(High,Low,Close,10),MinusDI(High,Low,Close,10))
     A<B(High,Lag(High,1))
     A>B(Lag(High,1),Lag(High,2))
df['DMI_SELL'] = 0
sell_cond = (df['Close']<df['SMA'])
sell_cond = sell_cond & (df['DI_PLUS'] < df['DI_MINUS'])
sell_cond = sell_cond & (df['High'] < (df['High'].shift(1)))
sell_cond = sell_cond & ((df['High'].shift(1)) > (df['High'].shift(2)))
df.loc[sell_cond, 'DMI_SELL'] = 1
df.tail(5)
| Open | High | Low | Close | Volume | DI_PLUS | DI_MINUS | SMA | CCI | DMI_OSC | DMI_BUY | DMI_SELL | |
|---|---|---|---|---|---|---|---|---|---|---|---|---|
| Date | ||||||||||||
| 2023-02-27 00:00:00-05:00 | 3992.36 | 4018.05 | 3973.55 | 3982.24 | 3836950000 | 22.890861 | 25.460095 | 4085.770000 | -89.591020 | -2.569235 | 0 | 0 |
| 2023-02-28 00:00:00-05:00 | 3977.19 | 3997.50 | 3968.98 | 3970.15 | 5043400000 | 20.601775 | 23.762409 | 4077.488889 | -86.569991 | -3.160634 | 0 | 1 |
| 2023-03-01 00:00:00-05:00 | 3963.34 | 3971.73 | 3939.05 | 3951.39 | 4249480000 | 18.541597 | 27.293832 | 4064.801667 | -97.115958 | -8.752235 | 0 | 0 |
| 2023-03-02 00:00:00-05:00 | 3938.68 | 3990.84 | 3928.16 | 3981.35 | 4244900000 | 20.326190 | 24.564449 | 4056.183333 | -72.464634 | -4.238259 | 0 | 0 |
| 2023-03-03 00:00:00-05:00 | 3998.02 | 4048.29 | 3995.17 | 4045.64 | 4084730000 | 29.051796 | 22.108004 | 4052.547778 | 4.893484 | 6.943792 | 0 | 0 |
CCI reversal signals:
BUY LONG CONDITIONS: [All of which must be true]

     A>=B(CCI(High,Low,Close,13,0.015),-100)
     A<B(Lag(CCI(High,Low,Close,13,0.015),1),-100)
     A<B(Lag(CCI(High,Low,Close,13,0.015),2),-100)
df['CCI_BUY'] = 0
buy_cond = (df['CCI']>=-100)
buy_cond = buy_cond & (df['CCI'].shift(1) < -100)
buy_cond = buy_cond & (df['CCI'].shift(2) < -100)
df.loc[buy_cond, 'CCI_BUY'] = 1
CCI reversal signals:
SELL LONG CONDITIONS: [All of which must be true]

     A<=B(CCI(High,Low,Close,13,0.015),100)
     A>B(Lag(CCI(High,Low,Close,13,0.015),1),100)
     A>B(Lag(CCI(High,Low,Close,13,0.015),2),100)
df['CCI_SELL'] = 0
sell_cond = (df['CCI']<=100)
sell_cond = sell_cond & (df['CCI'].shift(1) > 100)
sell_cond = sell_cond & (df['CCI'].shift(2) > 100)
df.loc[sell_cond, 'CCI_SELL'] = 1
display(df.head(5))
display(df.tail(5))
| Open | High | Low | Close | Volume | DI_PLUS | DI_MINUS | SMA | CCI | DMI_OSC | DMI_BUY | DMI_SELL | CCI_BUY | CCI_SELL | |
|---|---|---|---|---|---|---|---|---|---|---|---|---|---|---|
| Date | ||||||||||||||
| 2000-01-03 00:00:00-05:00 | 1469.25 | 1478.00 | 1438.36 | 1455.22 | 931800000 | NaN | NaN | NaN | NaN | NaN | 0 | 0 | 0 | 0 |
| 2000-01-04 00:00:00-05:00 | 1455.22 | 1455.22 | 1397.43 | 1399.42 | 1009000000 | NaN | NaN | NaN | -66.666667 | NaN | 0 | 0 | 0 | 0 |
| 2000-01-05 00:00:00-05:00 | 1399.42 | 1413.27 | 1377.68 | 1402.11 | 1085500000 | NaN | NaN | NaN | -79.700030 | NaN | 0 | 0 | 0 | 0 |
| 2000-01-06 00:00:00-05:00 | 1402.11 | 1411.90 | 1392.10 | 1403.45 | 1092300000 | NaN | NaN | NaN | -56.072933 | NaN | 0 | 0 | 0 | 0 |
| 2000-01-07 00:00:00-05:00 | 1403.45 | 1441.47 | 1400.73 | 1441.47 | 1225200000 | NaN | NaN | NaN | 27.884164 | NaN | 0 | 0 | 0 | 0 |
| Open | High | Low | Close | Volume | DI_PLUS | DI_MINUS | SMA | CCI | DMI_OSC | DMI_BUY | DMI_SELL | CCI_BUY | CCI_SELL | |
|---|---|---|---|---|---|---|---|---|---|---|---|---|---|---|
| Date | ||||||||||||||
| 2023-02-27 00:00:00-05:00 | 3992.36 | 4018.05 | 3973.55 | 3982.24 | 3836950000 | 22.890861 | 25.460095 | 4085.770000 | -89.591020 | -2.569235 | 0 | 0 | 1 | 0 |
| 2023-02-28 00:00:00-05:00 | 3977.19 | 3997.50 | 3968.98 | 3970.15 | 5043400000 | 20.601775 | 23.762409 | 4077.488889 | -86.569991 | -3.160634 | 0 | 1 | 0 | 0 |
| 2023-03-01 00:00:00-05:00 | 3963.34 | 3971.73 | 3939.05 | 3951.39 | 4249480000 | 18.541597 | 27.293832 | 4064.801667 | -97.115958 | -8.752235 | 0 | 0 | 0 | 0 |
| 2023-03-02 00:00:00-05:00 | 3938.68 | 3990.84 | 3928.16 | 3981.35 | 4244900000 | 20.326190 | 24.564449 | 4056.183333 | -72.464634 | -4.238259 | 0 | 0 | 0 | 0 |
| 2023-03-03 00:00:00-05:00 | 3998.02 | 4048.29 | 3995.17 | 4045.64 | 4084730000 | 29.051796 | 22.108004 | 4052.547778 | 4.893484 | 6.943792 | 0 | 0 | 0 | 0 |
df['DMI_BUY_Close'] = df['Close']*df['DMI_BUY']
df['DMI_SELL_Close'] = df['Close']*df['DMI_SELL']
df['CCI_BUY_Close'] = df['Close']*df['CCI_BUY']
df['CCI_SELL_Close'] = df['Close']*df['CCI_SELL']
display(df.tail(5))
| Open | High | Low | Close | Volume | DI_PLUS | DI_MINUS | SMA | CCI | DMI_OSC | DMI_BUY | DMI_SELL | CCI_BUY | CCI_SELL | DMI_BUY_Close | DMI_SELL_Close | CCI_BUY_Close | CCI_SELL_Close | |
|---|---|---|---|---|---|---|---|---|---|---|---|---|---|---|---|---|---|---|
| Date | ||||||||||||||||||
| 2023-02-27 00:00:00-05:00 | 3992.36 | 4018.05 | 3973.55 | 3982.24 | 3836950000 | 22.890861 | 25.460095 | 4085.770000 | -89.591020 | -2.569235 | 0 | 0 | 1 | 0 | 0.0 | 0.00 | 3982.24 | 0.0 |
| 2023-02-28 00:00:00-05:00 | 3977.19 | 3997.50 | 3968.98 | 3970.15 | 5043400000 | 20.601775 | 23.762409 | 4077.488889 | -86.569991 | -3.160634 | 0 | 1 | 0 | 0 | 0.0 | 3970.15 | 0.00 | 0.0 |
| 2023-03-01 00:00:00-05:00 | 3963.34 | 3971.73 | 3939.05 | 3951.39 | 4249480000 | 18.541597 | 27.293832 | 4064.801667 | -97.115958 | -8.752235 | 0 | 0 | 0 | 0 | 0.0 | 0.00 | 0.00 | 0.0 |
| 2023-03-02 00:00:00-05:00 | 3938.68 | 3990.84 | 3928.16 | 3981.35 | 4244900000 | 20.326190 | 24.564449 | 4056.183333 | -72.464634 | -4.238259 | 0 | 0 | 0 | 0 | 0.0 | 0.00 | 0.00 | 0.0 |
| 2023-03-03 00:00:00-05:00 | 3998.02 | 4048.29 | 3995.17 | 4045.64 | 4084730000 | 29.051796 | 22.108004 | 4052.547778 | 4.893484 | 6.943792 | 0 | 0 | 0 | 0 | 0.0 | 0.00 | 0.00 | 0.0 |
Visualize Signals
#from core.visuals import *
from visuals import *
start = -100
end = df.shape[0]
df_sub = df.iloc[start:end]
# df_sub = df[(df.index<='2019-04-01') & (df.index>='2019-01-24')]
#names = {'main_title': f'{ticker}'}
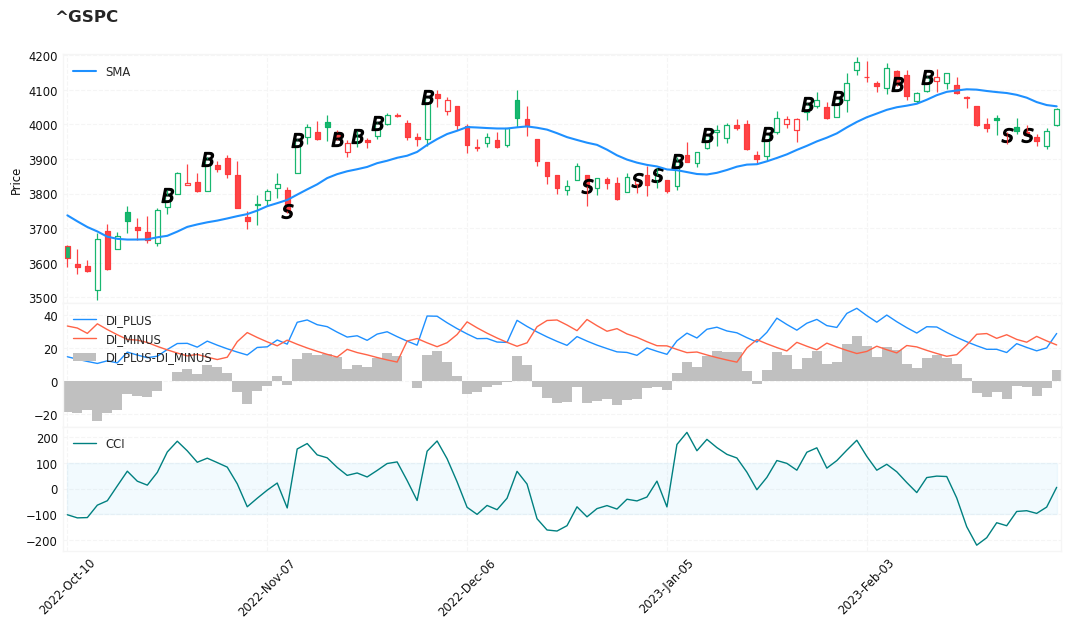
names = {'main_title': f'{ticker} - DMI oscillator continuation signals'}

lines0,  ax_cfg0 = plot_overlay_lines(data = df_sub, overlay_columns = ['SMA'])

lines1, ax_cfg1 = plot_macd(data = df_sub, macd= 'DI_PLUS', macd_signal = 'DI_MINUS', panel =1)

lines2, shadows2, ax_cfg2 = plot_add_lines(data = df_sub, line_columns=['CCI'],
                                           panel =2, bands = [-100, 100])
b_s_ = plot_buy_sell(data=df_sub, buy_column='DMI_BUY_Close', sell_column='DMI_SELL_Close')
lines_ = dict(**lines0, **lines1)
lines_.update(lines2)
lines_.update(b_s_)

shadows_ =    shadows2


fig_config_ = dict(figratio=(18,9), volume=False, volume_panel=2,panel_ratios=(4,2,2), tight_layout=True, returnfig=True,)

ax_cfg_ = ax_cfg0
ax_cfg_.update(ax_cfg1)
ax_cfg_.update(ax_cfg2)


names = {'main_title': f'{ticker}'}

aa_, bb_ = make_panels(main_data = df_sub[['Open', 'High', 'Low', 'Close', 'Volume']],
                       added_plots = lines_,
                       fill_betweens = shadows_,
                       fig_config = fig_config_,
                       axes_config = ax_cfg_,
                       names = names)
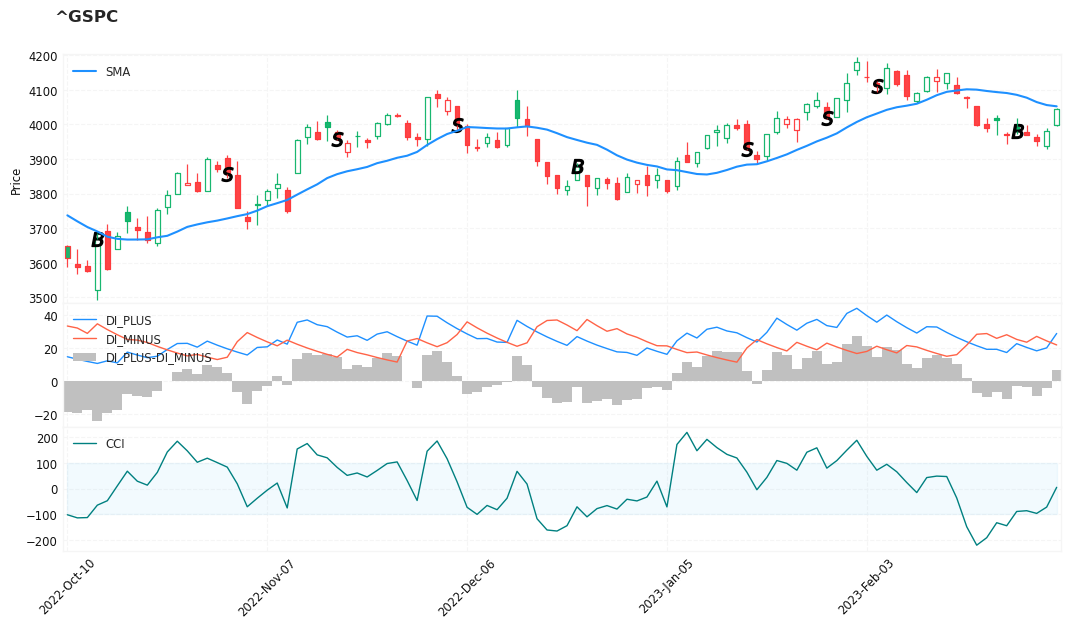
names = {'main_title': f'{ticker} - CCI reversal signals'}

lines0,  ax_cfg0 = plot_overlay_lines(data = df_sub, overlay_columns = ['SMA'])

lines1, ax_cfg1 = plot_macd(data = df_sub, macd= 'DI_PLUS', macd_signal = 'DI_MINUS', panel =1)

lines2, shadows2, ax_cfg2 = plot_add_lines(data = df_sub, line_columns=['CCI'],
                                           panel =2, bands = [-100, 100])
b_s_ = plot_buy_sell(data=df_sub, buy_column='CCI_BUY_Close', sell_column='CCI_SELL_Close')
lines_ = dict(**lines0, **lines1)
lines_.update(lines2)
lines_.update(b_s_)

shadows_ =    shadows2


fig_config_ = dict(figratio=(18,9), volume=False, volume_panel=2,panel_ratios=(4,2,2), tight_layout=True, returnfig=True,)

ax_cfg_ = ax_cfg0
ax_cfg_.update(ax_cfg1)
ax_cfg_.update(ax_cfg2)


names = {'main_title': f'{ticker}'}

aa_, bb_ = make_panels(main_data = df_sub[['Open', 'High', 'Low', 'Close', 'Volume']],
                       added_plots = lines_,
                       fill_betweens = shadows_,
                       fig_config = fig_config_,
                       axes_config = ax_cfg_,
                       names = names)
Combine a few
df_list = []
for ticker, df in dfs.items():
    df = df[['Open', 'High', 'Low', 'Close', 'Volume']].round(2)

    df_ta = TA.DMI(df, period = 10)
    df = df.merge(df_ta, left_index = True, right_index = True, how='inner' )

    del df_ta
    gc.collect()

    df['SMA'] = TA.SMA(df, period=18, column='close')
    df['CCI'] = TA.CCI(df, period=13)
    df['DMI_OSC']  = df['DI_PLUS'] - df['DI_MINUS']

    df['DMI_BUY'] = 0
    buy_cond = (df['Close']>df['SMA'])
    buy_cond = buy_cond & (df['DI_PLUS'] > df['DI_MINUS'])
    buy_cond = buy_cond & (df['Low'] > (df['Low'].shift(1)))
    buy_cond = buy_cond & ((df['Low'].shift(1)) < (df['Low'].shift(2)))
    df.loc[buy_cond, 'DMI_BUY'] = 1

    df['DMI_SELL'] = 0
    sell_cond = (df['Close']<df['SMA'])
    sell_cond = sell_cond & (df['DI_PLUS'] < df['DI_MINUS'])
    sell_cond = sell_cond & (df['High'] < (df['High'].shift(1)))
    sell_cond = sell_cond & ((df['High'].shift(1)) > (df['High'].shift(2)))
    df.loc[sell_cond, 'DMI_SELL'] = 1

    df['CCI_BUY'] = 0
    buy_cond = (df['CCI']>=-100)
    buy_cond = buy_cond & (df['CCI'].shift(1) < -100)
    buy_cond = buy_cond & (df['CCI'].shift(2) < -100)
    df.loc[buy_cond, 'CCI_BUY'] = 1

    df['CCI_SELL'] = 0
    sell_cond = (df['CCI']<=100)
    sell_cond = sell_cond & (df['CCI'].shift(1) > 100)
    sell_cond = sell_cond & (df['CCI'].shift(2) > 100)
    df.loc[sell_cond, 'CCI_SELL'] = 1

    df['ticker'] = ticker
    df_list.append(df)
df_all = pd.concat(df_list, axis=0)
print(df_all.shape)
df_all.tail(5)
(25416, 15)
| Open | High | Low | Close | Volume | DI_PLUS | DI_MINUS | SMA | CCI | DMI_OSC | DMI_BUY | DMI_SELL | CCI_BUY | CCI_SELL | ticker | |
|---|---|---|---|---|---|---|---|---|---|---|---|---|---|---|---|
| Date | |||||||||||||||
| 2023-02-27 00:00:00-05:00 | 41.44 | 41.73 | 40.73 | 40.78 | 26370300 | 3.973934 | 43.421312 | 43.223333 | -187.959124 | -39.447378 | 0 | 0 | 0 | 0 | ^GSPC |
| 2023-02-28 00:00:00-05:00 | 40.50 | 40.71 | 40.09 | 40.57 | 31086900 | 3.576541 | 48.532652 | 43.034444 | -183.366062 | -44.956111 | 0 | 0 | 0 | 0 | ^GSPC |
| 2023-03-01 00:00:00-05:00 | 40.56 | 40.76 | 40.14 | 40.18 | 21104400 | 3.957439 | 43.679387 | 42.803333 | -146.059638 | -39.721947 | 0 | 0 | 0 | 0 | ^GSPC |
| 2023-03-02 00:00:00-05:00 | 40.06 | 40.78 | 39.81 | 40.62 | 19110600 | 3.561695 | 43.939779 | 42.612222 | -112.054480 | -40.378084 | 0 | 0 | 0 | 0 | ^GSPC |
| 2023-03-03 00:00:00-05:00 | 40.91 | 41.18 | 40.74 | 41.15 | 20910700 | 8.807767 | 39.545801 | 42.467222 | -61.272471 | -30.738034 | 0 | 0 | 1 | 0 | ^GSPC |
dd = df_all.index
df_all.index = dd.date
df_all.index.name='Date'
df_all.to_csv('c_011_tasc202212.csv', index=True)