Weekly & Daily MACD
References
█ OVERVIEW
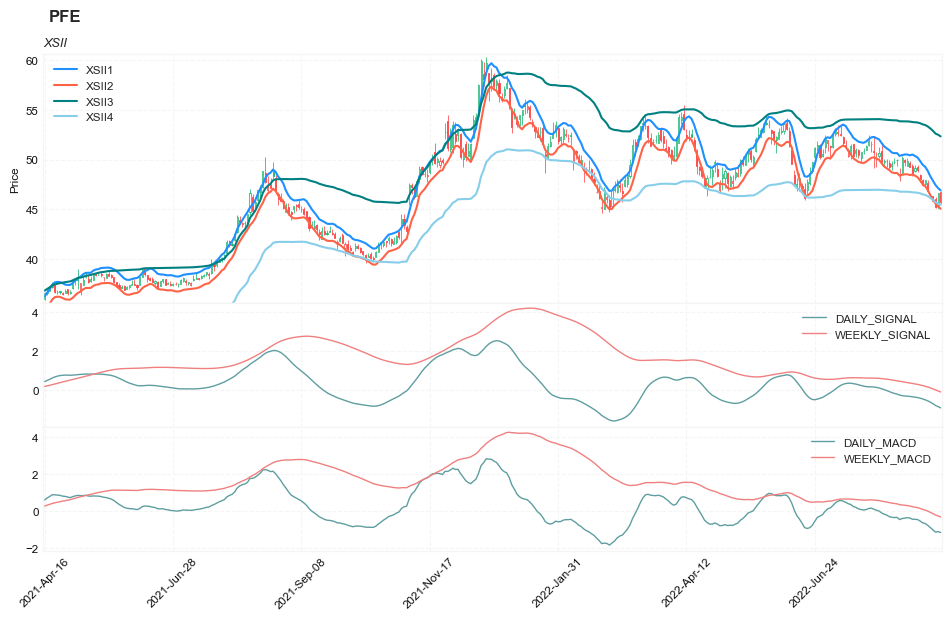
In the article "Weekly & Daily MACD" in this issue, author Vitali Apirine introduces a novel approach to using the classic MACD indicator in a way that simulates calculations based on different timeframes while using just a daily-interval chart. He describes a number of ways to use this new indicator that allows traders to adapt it to differing markets and conditions.
Load basic packages
import pandas as pd
import numpy as np
import os
import gc
import copy
from pathlib import Path
from datetime import datetime, timedelta, time, date
#this package is to download equity price data from yahoo finance
#the source code of this package can be found here: https://github.com/ranaroussi/yfinance/blob/main
import yfinance as yf
pd.options.display.max_rows = 100
pd.options.display.max_columns = 100

import warnings
warnings.filterwarnings("ignore")

import pytorch_lightning as pl
random_seed=1234
pl.seed_everything(random_seed)
Global seed set to 1234


1234
Download data
##### Download data#S&P 500 (^GSPC),  Dow Jones Industrial Average (^DJI), NASDAQ Composite (^IXIC)
#Russell 2000 (^RUT), Crude Oil Nov 21 (CL=F), Gold Dec 21 (GC=F)
#Treasury Yield 10 Years (^TNX)
#CBOE Volatility Index (^VIX) Chicago Options - Chicago Options Delayed Price. Currency in USD

#benchmark_tickers = ['^GSPC', '^DJI', '^IXIC', '^RUT',  'CL=F', 'GC=F', '^TNX']

benchmark_tickers = ['^GSPC', '^VIX']
tickers = benchmark_tickers + ['GSK', 'BST', 'PFE']
#https://github.com/ranaroussi/yfinance/blob/main/yfinance/base.py
#     def history(self, period="1mo", interval="1d",
#                 start=None, end=None, prepost=False, actions=True,
#                 auto_adjust=True, back_adjust=False,
#                 proxy=None, rounding=False, tz=None, timeout=None, **kwargs):

dfs = {}

for ticker in tickers:
    cur_data = yf.Ticker(ticker)
    hist = cur_data.history(period="max", start='2000-01-01')
    print(datetime.now(), ticker, hist.shape, hist.index.min(), hist.index.max())
    dfs[ticker] = hist
2022-09-04 23:00:36.564993 ^GSPC (5706, 7) 1999-12-31 00:00:00 2022-09-02 00:00:00
2022-09-04 23:00:36.879870 ^VIX (5706, 7) 1999-12-31 00:00:00 2022-09-02 00:00:00
2022-09-04 23:00:37.172501 GSK (5706, 7) 1999-12-31 00:00:00 2022-09-02 00:00:00
2022-09-04 23:00:37.447286 BST (1976, 7) 2014-10-29 00:00:00 2022-09-02 00:00:00
2022-09-04 23:00:37.832612 PFE (5706, 7) 1999-12-31 00:00:00 2022-09-02 00:00:00
ticker = 'PFE'
dfs[ticker].tail(5)
| Open | High | Low | Close | Volume | Dividends | Stock Splits | |
|---|---|---|---|---|---|---|---|
| Date | |||||||
| 2022-08-29 | 46.380001 | 46.689999 | 46.119999 | 46.230000 | 13400500 | 0.0 | 0.0 |
| 2022-08-30 | 46.340000 | 46.349998 | 45.799999 | 45.849998 | 16303000 | 0.0 | 0.0 |
| 2022-08-31 | 46.009998 | 46.290001 | 45.130001 | 45.230000 | 26416800 | 0.0 | 0.0 |
| 2022-09-01 | 45.139999 | 46.650002 | 45.139999 | 46.630001 | 19947600 | 0.0 | 0.0 |
| 2022-09-02 | 46.740002 | 46.799999 | 45.529999 | 45.700001 | 14662700 | 0.0 | 0.0 |
Calculate the technical indicators and Find signals
from core.finta import TA
df = dfs[ticker][['Open', 'High', 'Low', 'Close', 'Volume']]
df = df.round(2)
df_ta = TA.BBANDS(df, period = 20, std_multiplier=2.2, column="close")
df = df.merge(df_ta, left_index = True, right_index = True, how='inner' )

df_ta = TA.XSII(df, slow_period = 102, fast_period = 7)
df = df.merge(df_ta, left_index = True, right_index = True, how='inner' )

df_ta = TA.MACD(df, fast_period = 12, slow_period = 26, signal = 9, column = 'close')
df_ta.columns = [f'DAILY_{c}' for c in df_ta.columns]
df = df.merge(df_ta, left_index = True, right_index = True, how='inner' )

df_ta = TA.MACD(df, fast_period = 60, slow_period = 130, signal = 9, column = 'close')
df_ta.columns = [f'WEEKLY_{c}' for c in df_ta.columns]
df = df.merge(df_ta, left_index = True, right_index = True, how='inner' )

del df_ta
gc.collect()
38
df['B'] = 0
display(df.head(5))
display(df.tail(5))
| Open | High | Low | Close | Volume | BB_UPPER | BB_MIDDLE | BB_LOWER | XSII1 | XSII2 | XSII3 | XSII4 | DAILY_MACD | DAILY_SIGNAL | WEEKLY_MACD | WEEKLY_SIGNAL | B | |
|---|---|---|---|---|---|---|---|---|---|---|---|---|---|---|---|---|---|
| Date | |||||||||||||||||
| 1999-12-31 | 14.25 | 14.31 | 14.11 | 14.22 | 5939817 | NaN | NaN | NaN | NaN | NaN | 15.2154 | 13.2246 | 0.000000 | 0.000000 | 0.000000 | 0.000000 | 0 |
| 2000-01-03 | 14.06 | 14.20 | 13.87 | 13.98 | 12873345 | NaN | NaN | NaN | NaN | NaN | 14.9586 | 13.0014 | -0.005385 | -0.002991 | -0.001077 | -0.000598 | 0 |
| 2000-01-04 | 13.70 | 13.81 | 13.16 | 13.46 | 14208974 | NaN | NaN | NaN | NaN | NaN | 14.4022 | 12.5178 | -0.022986 | -0.011186 | -0.004560 | -0.002222 | 0 |
| 2000-01-05 | 13.54 | 13.98 | 13.51 | 13.68 | 12981591 | NaN | NaN | NaN | NaN | NaN | 14.6376 | 12.7224 | -0.022485 | -0.015014 | -0.004749 | -0.003078 | 0 |
| 2000-01-06 | 13.70 | 14.36 | 13.68 | 14.17 | 11115273 | NaN | NaN | NaN | 14.17851 | 13.62249 | 15.1619 | 13.1781 | -0.002242 | -0.011214 | -0.001242 | -0.002532 | 0 |
| Open | High | Low | Close | Volume | BB_UPPER | BB_MIDDLE | BB_LOWER | XSII1 | XSII2 | XSII3 | XSII4 | DAILY_MACD | DAILY_SIGNAL | WEEKLY_MACD | WEEKLY_SIGNAL | B | |
|---|---|---|---|---|---|---|---|---|---|---|---|---|---|---|---|---|---|
| Date | |||||||||||||||||
| 2022-08-29 | 46.38 | 46.69 | 46.12 | 46.23 | 13400500 | 51.392579 | 48.9140 | 46.435421 | 48.30414 | 46.40986 | 53.102620 | 46.154613 | -0.906411 | -0.633650 | -0.073433 | 0.103551 | 0 |
| 2022-08-30 | 46.34 | 46.35 | 45.80 | 45.85 | 16303000 | 51.584454 | 48.7220 | 45.859546 | 47.87319 | 45.99581 | 52.873627 | 45.955582 | -1.021035 | -0.711127 | -0.141759 | 0.054489 | 0 |
| 2022-08-31 | 46.01 | 46.29 | 45.13 | 45.23 | 26416800 | 51.761125 | 48.4905 | 45.219875 | 47.44632 | 45.58568 | 52.594719 | 45.713167 | -1.148664 | -0.798635 | -0.217627 | 0.000066 | 0 |
| 2022-09-01 | 45.14 | 46.65 | 45.14 | 46.63 | 19947600 | 51.640812 | 48.3290 | 45.017188 | 47.14185 | 45.29315 | 52.479243 | 45.612800 | -1.123887 | -0.863685 | -0.265250 | -0.052997 | 0 |
| 2022-09-02 | 46.74 | 46.80 | 45.53 | 45.70 | 14662700 | 51.663455 | 48.1505 | 44.637545 | 46.90878 | 45.06922 | 52.314323 | 45.469459 | -1.165855 | -0.924119 | -0.326770 | -0.107752 | 0 |
Visual
from core.visuals import *
start = -350
end = df.shape[0]
df_sub = df.iloc[start:end]
# df_sub = df[(df.index<='2019-04-01') & (df.index>='2019-01-24')]
names = {'main_title': f'{ticker}'}
lines0 = basic_lines(df_sub[['XSII1', 'XSII2', 'XSII3', 'XSII4']],
                     colors = [],
                     **dict(panel=0, width=1.5, secondary_y=False))

lines1 = basic_lines(df_sub[['DAILY_SIGNAL', 'WEEKLY_SIGNAL']],
                     colors = ['cadetblue', 'lightcoral'],
                     **dict(panel=1, width=1, secondary_y=False))
lines3 = basic_lines(df_sub[['DAILY_MACD', 'WEEKLY_MACD']],
                     colors = ['cadetblue', 'lightcoral'],
                     **dict(panel=2, width=1, secondary_y=False))

lines2 = basic_lines(df_sub[[ 'B']],
                     colors = ['navy'],
                     **dict(panel=0, type='scatter', marker=r'${B}$' , markersize=100, secondary_y=False))


lines_ = dict(**lines0, **lines1)
lines_.update(lines2)
lines_.update(lines3)

#shadows_ = basic_shadows(bands=[-0.01, 0.01], nsamples=df.iloc[start:end].shape[0], **dict(panel=1, color="lightskyblue",alpha=0.1,interpolate=True))
shadows_ = []
fig_config_ = dict(figratio=(18,10), volume=False, volume_panel=2,panel_ratios=(4,2, 2), tight_layout=True, returnfig=True,)

ax_cfg_ = {0:dict(basic=[6, 2, ['XSII1', 'XSII2', 'XSII3', 'XSII4']],
                 title=dict(label = 'XSII', fontsize=9, style='italic',  loc='left'),
                ),
           2:dict(basic=[2, 0, ['DAILY_SIGNAL', 'WEEKLY_SIGNAL']]
                ),
           4:dict(basic=[2, 0, ['DAILY_MACD', 'WEEKLY_MACD']]
                ),
          }


names = {'main_title': f'{ticker}'}

aa_, bb_ = make_panels(main_data = df_sub[['Open', 'High', 'Low', 'Close', 'Volume']],
                       added_plots = lines_,
                       fill_betweens = shadows_,
                       fig_config = fig_config_,
                       axes_config = ax_cfg_,
                       names = names)