Backtesting A Mean-Reversion Strategy In Python
References
█ OVERVIEW
For this month's Traders' Tips, the focus is Anthony Garner's article in this issue, "Backtesting A Mean-Reversion Strategy In Python." Here, we present the May 2019 Traders' Tips code with possible implementations in various software.
In "Backtesting A Mean-Reversion Strategy In Python" in this issue, author Anthony Garner introduces a strategy based on the concept of buying an oversold asset and selling an overbought asset. To quantify this, he uses the classic z-score calculation. In addition, he adds a component to evaluate the existing trend as well as position sizing to allow for reinvestment.
Here is TradeStation EasyLanguage code for an indicator and strategy based on the author's concepts. We also included a function for calculating the z-score that can be used in your own code.
█ STRATEGY
- trade setup
- starting pricinpal: 10000
- min trade size: 100
- max trade size: 10000
- signal setup
- calculate the z-score of period = 10
- calculate ma_fast of period = 10
- calculate ma_slow of period = 100
- Trade at the next day of ENTER/EXIT signal
- BUY signal: z-score < -1 AND ma_fast > ma_slow
- SELL: z-score > -0.5
- SELL SHORT signal: z-score > 1 AND ma_fast < ma_slow
- BUY to COVER: z-score < 0.5
- ma_fast crosses over ma_slow: BUY to COVER
- ma_fast crosses under ma)slow: SELL
Load basic packages
import pandas as pd
import numpy as np
import os
import gc
import copy
from pathlib import Path
from datetime import datetime, timedelta, time, date
#this package is to download equity price data from yahoo finance
#the source code of this package can be found here: https://github.com/ranaroussi/yfinance/blob/main
import yfinance as yf
pd.options.display.max_rows = 100
pd.options.display.max_columns = 100

import warnings
warnings.filterwarnings("ignore")

import pytorch_lightning as pl
random_seed=1234
pl.seed_everything(random_seed)
Global seed set to 1234


1234
Download data
#S&P 500 (^GSPC),  Dow Jones Industrial Average (^DJI), NASDAQ Composite (^IXIC)
#Russell 2000 (^RUT), Crude Oil Nov 21 (CL=F), Gold Dec 21 (GC=F)
#Treasury Yield 10 Years (^TNX)
#CBOE Volatility Index (^VIX) Chicago Options - Chicago Options Delayed Price. Currency in USD

#benchmark_tickers = ['^GSPC', '^DJI', '^IXIC', '^RUT',  'CL=F', 'GC=F', '^TNX']

benchmark_tickers = ['^GSPC', '^VIX']
tickers = benchmark_tickers + ['GSK', 'BST', 'PFE']
#https://github.com/ranaroussi/yfinance/blob/main/yfinance/base.py
#     def history(self, period="1mo", interval="1d",
#                 start=None, end=None, prepost=False, actions=True,
#                 auto_adjust=True, back_adjust=False,
#                 proxy=None, rounding=False, tz=None, timeout=None, **kwargs):

dfs = {}

for ticker in tickers:
    cur_data = yf.Ticker(ticker)
    hist = cur_data.history(period="max", start='2000-01-01')
    print(datetime.now(), ticker, hist.shape, hist.index.min(), hist.index.max())
    dfs[ticker] = hist
2022-09-04 18:54:52.134508 ^GSPC (5706, 7) 1999-12-31 00:00:00 2022-09-02 00:00:00
2022-09-04 18:54:52.509531 ^VIX (5706, 7) 1999-12-31 00:00:00 2022-09-02 00:00:00
2022-09-04 18:54:52.889206 GSK (5706, 7) 1999-12-31 00:00:00 2022-09-02 00:00:00
2022-09-04 18:54:53.195667 BST (1976, 7) 2014-10-29 00:00:00 2022-09-02 00:00:00
2022-09-04 18:54:53.639234 PFE (5706, 7) 1999-12-31 00:00:00 2022-09-02 00:00:00
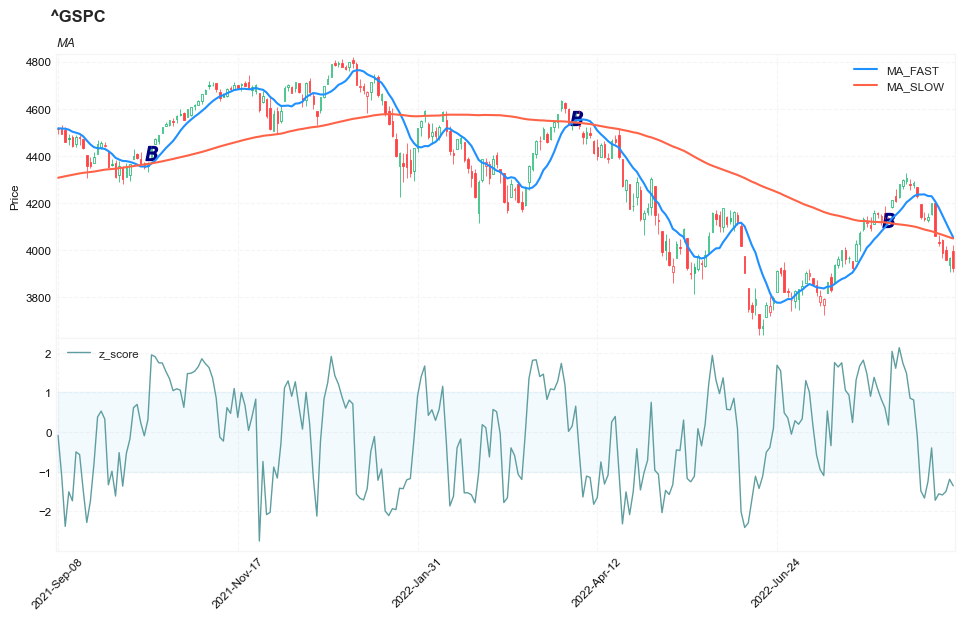
ticker = '^GSPC'
# ticker = 'PFE'
dfs[ticker].tail(5)
| Open | High | Low | Close | Volume | Dividends | Stock Splits | |
|---|---|---|---|---|---|---|---|
| Date | |||||||
| 2022-08-29 | 4034.580078 | 4062.989990 | 4017.419922 | 4030.610107 | 2963020000 | 0 | 0 |
| 2022-08-30 | 4041.250000 | 4044.979980 | 3965.209961 | 3986.159912 | 3190580000 | 0 | 0 |
| 2022-08-31 | 4000.669922 | 4015.370117 | 3954.530029 | 3955.000000 | 3797860000 | 0 | 0 |
| 2022-09-01 | 3936.729980 | 3970.229980 | 3903.649902 | 3966.850098 | 3754570000 | 0 | 0 |
| 2022-09-02 | 3994.659912 | 4018.429932 | 3906.209961 | 3924.260010 | 4134920000 | 0 | 0 |
Calculate the technical indicators
def _zscore(_data, _len):
    roll_ = _data.rolling(window=_len, min_periods = _len)
    z_ = (_data - roll_.mean())/roll_.std()
    return z_
from core.finta import TA
z_period = 10
fast_period = 10
slow_period = 100
help(TA.SMA)
Help on function SMA in module core.finta:

SMA(ohlc: pandas.core.frame.DataFrame, period: int = 41, column: str = 'close') -> pandas.core.series.Series
    Simple moving average - rolling mean in pandas lingo. Also known as 'MA'.
    The simple moving average (SMA) is the most basic of the moving averages used for trading.
df = dfs[ticker][['Open', 'High', 'Low', 'Close', 'Volume']]
df = df.round(2)
df_ta = TA.SMA(df, period = fast_period, column="close")
df_ta.name='MA_FAST'
df = df.merge(df_ta, left_index = True, right_index = True, how='inner' )

df_ta = TA.SMA(df, period = slow_period, column="close")
df_ta.name='MA_SLOW'
df = df.merge(df_ta, left_index = True, right_index = True, how='inner' )

del df_ta
gc.collect()
38
df['z_score'] = _zscore(df['Close'], z_period)
display(df.head(5))
display(df.tail(5))
| Open | High | Low | Close | Volume | MA_FAST | MA_SLOW | z_score | |
|---|---|---|---|---|---|---|---|---|
| Date | ||||||||
| 1999-12-31 | 1464.47 | 1472.42 | 1458.19 | 1469.25 | 374050000 | NaN | NaN | NaN |
| 2000-01-03 | 1469.25 | 1478.00 | 1438.36 | 1455.22 | 931800000 | NaN | NaN | NaN |
| 2000-01-04 | 1455.22 | 1455.22 | 1397.43 | 1399.42 | 1009000000 | NaN | NaN | NaN |
| 2000-01-05 | 1399.42 | 1413.27 | 1377.68 | 1402.11 | 1085500000 | NaN | NaN | NaN |
| 2000-01-06 | 1402.11 | 1411.90 | 1392.10 | 1403.45 | 1092300000 | NaN | NaN | NaN |
| Open | High | Low | Close | Volume | MA_FAST | MA_SLOW | z_score | |
|---|---|---|---|---|---|---|---|---|
| Date | ||||||||
| 2022-08-29 | 4034.58 | 4062.99 | 4017.42 | 4030.61 | 2963020000 | 4178.634 | 4068.3812 | -1.558438 |
| 2022-08-30 | 4041.25 | 4044.98 | 3965.21 | 3986.16 | 3190580000 | 4146.730 | 4063.4313 | -1.587777 |
| 2022-08-31 | 4000.67 | 4015.37 | 3954.53 | 3955.00 | 3797860000 | 4114.826 | 4057.9792 | -1.498243 |
| 2022-09-01 | 3936.73 | 3970.23 | 3903.65 | 3966.85 | 3754570000 | 4083.137 | 4052.7649 | -1.191407 |
| 2022-09-02 | 3994.66 | 4018.43 | 3906.21 | 3924.26 | 4134920000 | 4052.715 | 4047.8822 | -1.357369 |
Find signals
- BUY signal: z-score < -1 AND ma_fast > ma_slow
    - SELL: z-score > -0.5
- SELL SHORT signal: z-score > 1 AND ma_fast < ma_slow
    - BUY to COVER: z-score < 0.5
- ma_fast crosses over ma_slow: BUY to COVER
- ma_fast crosses under ma_slow: SELL
df.dropna(how='any', inplace=True)
#1: BUY signal: z-score < -1 AND ma_fast > ma_slow
#2: ma_fast crosses over ma_slow: BUY to COVER
#-1: SELL SHORT signal: z-score > 1 AND ma_fast < ma_slow
#-2: ma_fast crosses under ma_slow: SELL
enter_zscore = 1
exit_zscore = 0.5

signals = [0]
for i in range(1, df.shape[0]):
    row = df.iloc[i]
    z_ = row['z_score']
    ma_f = row['MA_FAST']
    ma_s = row['MA_SLOW']

    row_j = df.iloc[i-1]
    pre_ma_f = row_j['MA_FAST']
    pre_ma_s = row_j['MA_SLOW']

    s_ = 0
    if (z_ < -enter_zscore) & (ma_f > ma_s):
        s_ = 1
    elif (z_ > enter_zscore) & (ma_f < ma_s):
        s_ = -1
    elif (pre_ma_f < pre_ma_s) & (ma_f >= ma_s):
        s_ = 2
    elif (pre_ma_f > pre_ma_s) & (ma_f <= ma_s):
        s_ = -2

    signals.append(s_)

df['SIGNAL'] = signals
Visual
df['SIGNAL'].value_counts()
 0    4380
 1     690
-1     460
 2      39
-2      38
Name: SIGNAL, dtype: int64
df['B1'] = (df['SIGNAL']==1).astype(int)*(df['High'] + df['Low'])/2
df['B2'] = (df['SIGNAL']==2).astype(int)*(df['High'] + df['Low'])/2
df['S1'] = (df['SIGNAL']==-1).astype(int)*(df['High'] + df['Low'])/2
df['S2'] = (df['SIGNAL']==-2).astype(int)*(df['High'] + df['Low'])/2
from core.visuals import *
start = -250
end = df.shape[0]

names = {'main_title': f'{ticker}'}
lines0 = basic_lines(df.iloc[start:end][['MA_FAST', 'MA_SLOW']],
                     colors = [],
                     **dict(panel=0, width=1.5, secondary_y=False))

lines1 = basic_lines(df.iloc[start:end][['z_score']],
                     colors = ['cadetblue'],
                     **dict(panel=1, width=1, secondary_y=False))

lines2 = basic_lines(df.iloc[start:end][[ 'B2']],
                     colors = ['navy'],
                     **dict(panel=0, type='scatter', marker=r'${B}$' , markersize=100, secondary_y=False))


lines_ = dict(**lines0, **lines1)
lines_.update(lines2)

shadows_ = basic_shadows(bands=[-1, 1], nsamples=df.iloc[start:end].shape[0], **dict(panel=1, color="lightskyblue",alpha=0.1,interpolate=True))

fig_config_ = dict(figratio=(18,10), volume=False, volume_panel=2,panel_ratios=(4,3), tight_layout=True, returnfig=True,)

ax_cfg_ = {0:dict(basic=[4, 2, ['MA_FAST', 'MA_SLOW']],
                 title=dict(label = 'MA', fontsize=9, style='italic',  loc='left'),
                ),
           2:dict(basic=[1, 0, ['z_score',]]
                ),
          }


names = {'main_title': f'{ticker}'}

aa_, bb_ = make_panels(main_data = df.iloc[start:end][['Open', 'High', 'Low', 'Close', 'Volume']],
                       added_plots = lines_,
                       fill_betweens = shadows_,
                       fig_config = fig_config_,
                       axes_config = ax_cfg_,
                       names = names)
Simulate
TRADE_CONFIG = dict(InitialCapital = 10000 ,
                    LeverageToUse =  2 ,
                    MinTradeSize = 100 ,
                    MaxTradeSize = 1000
                   )