Markov-Switching Regime Detection
Markov-switching dynamic regression (Statsmodels MarkovRegression) models are fitted to detect latent regimes in a market-derived target series (S&P 500).
Multiple specifications (different number of regimes, lag features, switching variance) are compared, and the best model is selected by BIC. From this model, insights are derived regarding the regimes persistence, transition dynamics, and regime-conditional behavior.
Data & target construction
- Universe: S&P 500 index (
^GSPC) - Source:
yfinance - Sample downloaded: 6546 daily records from 2000-01-03 to 2026-01-12
- Forward window: 20 trading days
Forward 20-day max return target
For each date \(t\) with close \(C_t\):
\[target_t = 100 \times \frac{\max(C_{t+1}, \dots, C_{t+20}) - C_t}{C_t}\]Observed target statistics (after dropping tail NaNs):
- Mean: 2.92%
- Std: 2.73%
- Range: [-5.27%, 28.48%]
Lagged features
We build autoregressive inputs from the target:
lag1 = target_{t-1}lag20 = target_{t-20}
Final modeling dataset: 6506 observations.
Train/test split (time-based)
- Train: 6406 samples (2000-02-01 → 2025-07-22)
- Test: 100 samples (2025-07-23 → 2025-12-11)
Model zoo (what we fit)
All models are estimated using statsmodels.tsa.MarkovRegression on the training set:
2_regime: 2 regimes, switching intercept5_regime: 5 regimes, switching intercept3_regime_exog: 3 regimes, switching intercept + exog (lag1,lag20)3_regime_var: 3 regimes, switching variance + exog (lag20)3_regime_full: 3 regimes, switching variance + exog (lag1,lag20)
Model comparison
Lower AIC/BIC indicates better fit (with BIC penalizing complexity more strongly).
| Model | Description | K | Params | LogLik | AIC | BIC |
|---|---|---|---|---|---|---|
3_regime_full | 3 regimes, switching variance, lag1 & lag20 | 3 | 18 | -9137.95 | 18311.89 | 18433.66 |
3_regime_exog | 3 regimes, switching intercept & exog (lag1, lag20) | 3 | 16 | -10240.30 | 20512.60 | 20620.84 |
5_regime | 5 regimes, switching intercept | 5 | 26 | -11358.68 | 22769.37 | 22945.26 |
3_regime_var | 3 regimes, switching variance, lag20 | 3 | 15 | -11771.77 | 23573.55 | 23675.02 |
2_regime | 2 regimes, switching intercept | 2 | 5 | -13831.51 | 27673.02 | 27706.85 |
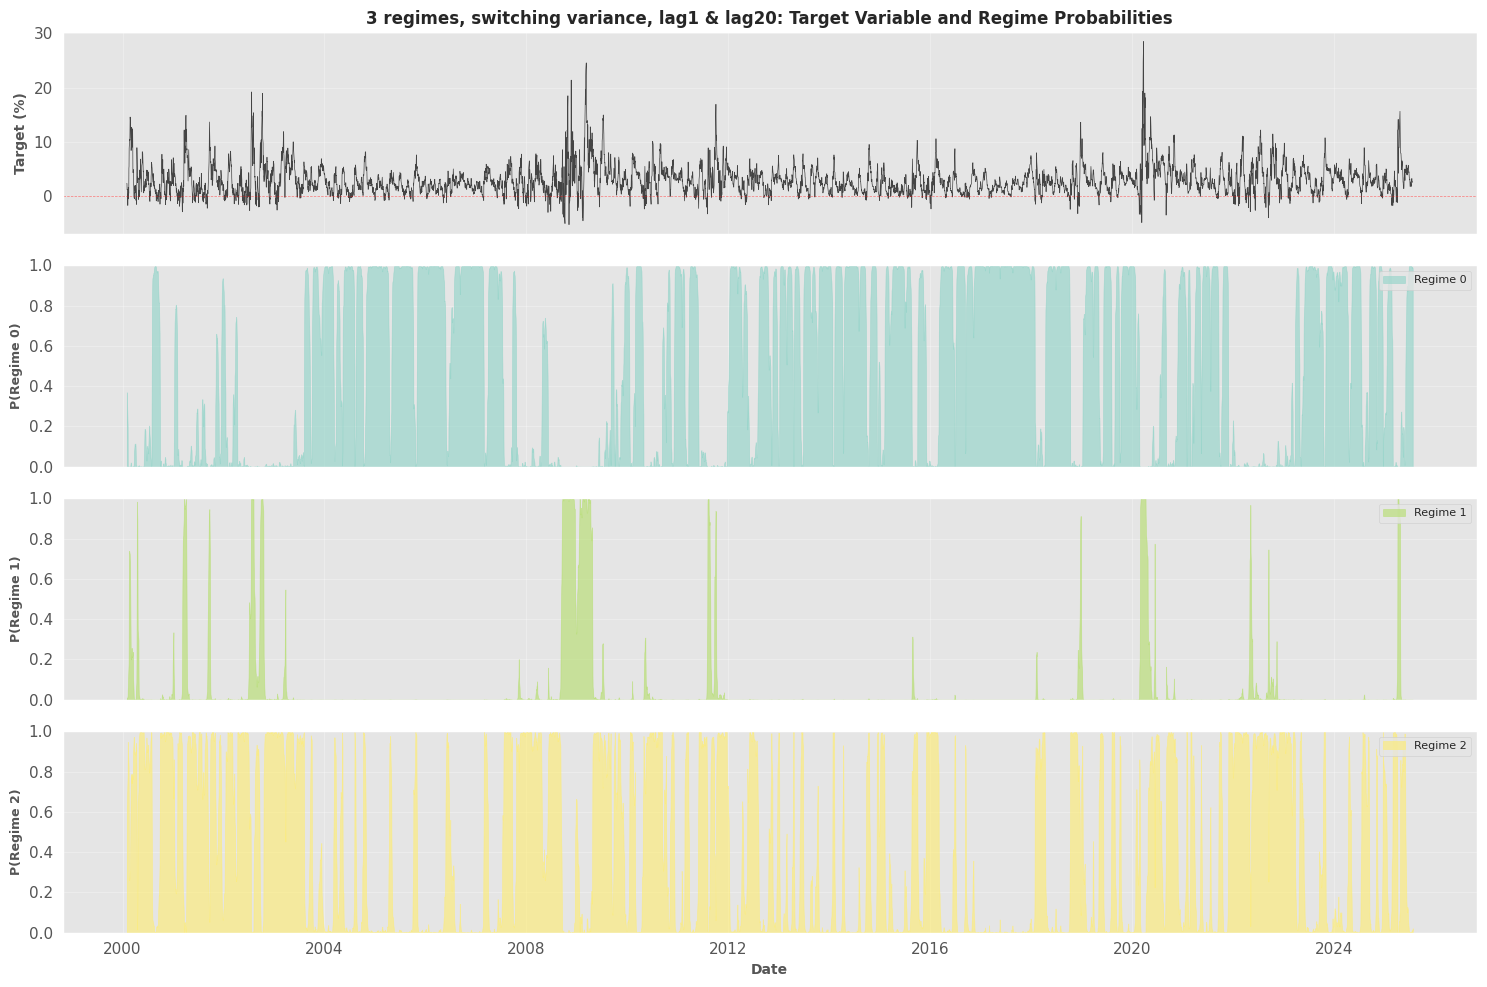
Selected best model (lowest BIC): 3_regime_full
Best model: 3_regime_full
Specification
- 3 regimes
- switching variance enabled
- exogenous regressors:
lag1,lag20 - trend/intercept included
Regime persistence (expected durations)
- Regime 0: 40.55 days
- Regime 1: 16.11 days
- Regime 2: 25.15 days
Transition probability matrix (smoothed estimates)
| From \ To | 0 | 1 | 2 |
|---|---|---|---|
| 0 | 0.9753 | 0.0003 | 0.0315 |
| 1 | 0.0000 | 0.9379 | 0.0083 |
| 2 | 0.0247 | 0.0617 | 0.9602 |
Interpretation (high level):
- Regime 0 and Regime 2 are highly persistent (diagonal near 0.96–0.98).
- Regime 1 is rarer and shorter-lived, with persistence ~0.94 and more frequent transitions out.
Regime period statistics (training set)
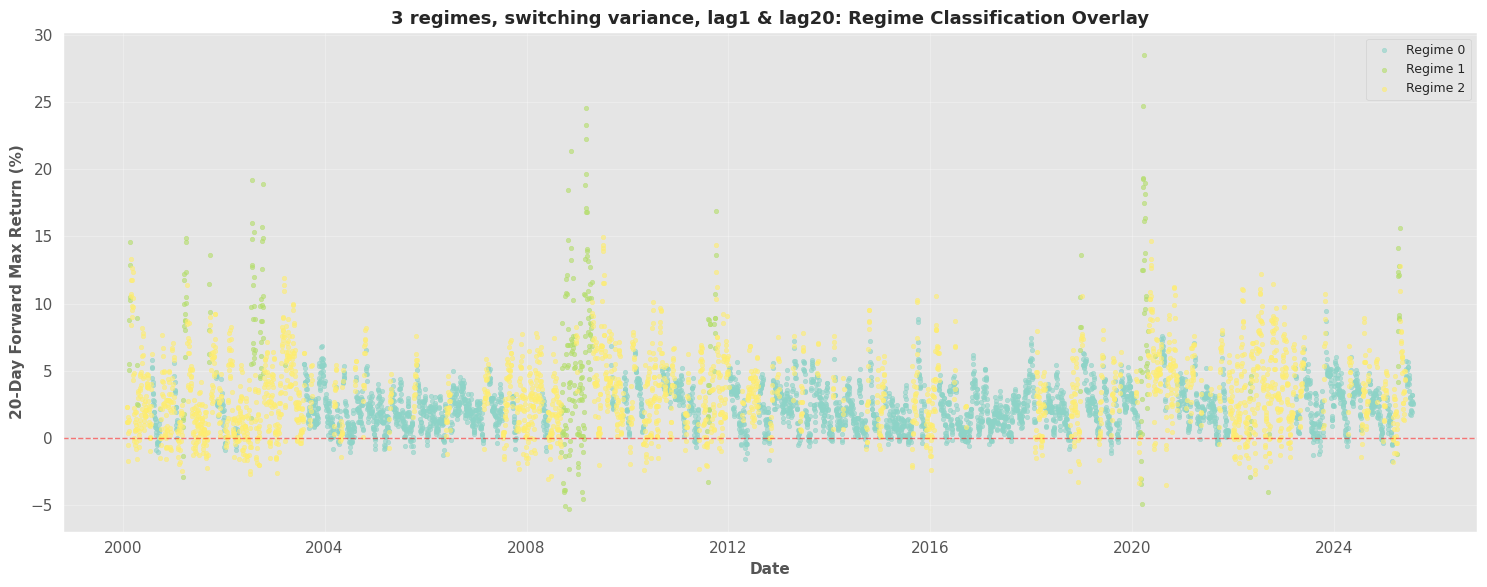
Regimes are assigned via \(\arg\max_i P(S_t=i)\) using smoothed marginal probabilities.
Regime 0 (dominant, “low dispersion”)
- Frequency: 3428 days (53.5%)
- Mean target: 2.248%
- Std: 1.572%
- Min/Max: -1.706% / 9.420%
- Longest streak: 343 consecutive days
Regime 1 (rare, “high opportunity / high dispersion”)
- Frequency: 320 days (5.0%)
- Mean target: 6.948%
- Std: 5.925%
- Min/Max: -5.268% / 28.478%
- Longest streak: 74 consecutive days
Regime 2 (common, “medium dispersion”)
- Frequency: 2658 days (41.5%)
- Mean target: 3.322%
- Std: 2.837%
- Min/Max: -3.513% / 14.941%
- Longest streak: 131 consecutive days
======================================================================
MARKOV SWITCHING DYNAMIC REGRESSION ANALYSIS
======================================================================
Downloading data for ^GSPC...
Downloaded 6546 records from 2000-01-03 to 2026-01-12
Calculated forward 20-day max return
Target stats: mean=2.92%, std=2.73%
Range: [-5.27%, 28.48%]
Created lagged features: ['lag1', 'lag20']
Final dataset size: 6506 observations
Data Split:
Training: 6406 samples (2000-02-01 to 2025-07-22)
Testing: 100 samples (2025-07-23 to 2025-12-11)

======================================================================
FITTING MARKOV SWITCHING MODELS
======================================================================

[1/5] Fitting 2-regime model (switching intercept)...
AIC: 27673.02, BIC: 27706.85

[2/5] Fitting 5-regime model (switching intercept)...
AIC: 22769.37, BIC: 22945.26

[3/5] Fitting 3-regime model with lag features...
AIC: 20512.60, BIC: 20620.84

[4/5] Fitting 3-regime model with switching variance...
AIC: 23573.55, BIC: 23675.02

[5/5] Fitting comprehensive 3-regime model...
AIC: 18311.89, BIC: 18433.66

======================================================================
MODEL COMPARISON
======================================================================
        Model                                         Description  K_Regimes  N_Params  Log_Likelihood          AIC          BIC         HQIC
3_regime_full         3 regimes, switching variance, lag1 & lag20          3        18    -9137.947100 18311.894201 18433.664027 18354.041756
3_regime_exog 3 regimes, switching intercept & exog (lag1, lag20)          3        16   -10240.298946 20512.597891 20620.837737 20550.062385
     5_regime                      5 regimes, switching intercept          5        26   -11358.683365 22769.366730 22945.256478 22830.246531
 3_regime_var                3 regimes, switching variance, lag20          3        15   -11771.772696 23573.545393 23675.020248 23608.668355
     2_regime                      2 regimes, switching intercept          2         5   -13831.511662 27673.023324 27706.848275 27684.730978

Lower AIC/BIC indicates better model fit

======================================================================
BEST MODEL: 3_regime_full
======================================================================
                        Markov Switching Model Results
==============================================================================
Dep. Variable:                 target   No. Observations:                 6406
Model:               MarkovRegression   Log Likelihood               -9137.947
Date:                Tue, 13 Jan 2026   AIC                          18311.894
Time:                        08:01:47   BIC                          18433.664
Sample:                             0   HQIC                         18354.042
                               - 6406
Covariance Type:               approx
                             Regime 0 parameters
==============================================================================
                 coef    std err          z      P>|z|      [0.025      0.975]
------------------------------------------------------------------------------
const          0.1733      0.027      6.438      0.000       0.121       0.226
x1             0.8986      0.008    111.822      0.000       0.883       0.914
x2            -0.0019      0.006     -0.290      0.772      -0.014       0.011
sigma2         0.3700      0.017     21.965      0.000       0.337       0.403
                             Regime 1 parameters
==============================================================================
                 coef    std err          z      P>|z|      [0.025      0.975]
------------------------------------------------------------------------------
const          1.6765      0.462      3.629      0.000       0.771       2.582
x1             0.7863      0.041     19.089      0.000       0.706       0.867
x2            -0.0150      0.039     -0.387      0.699      -0.091       0.061
sigma2        12.9299      1.883      6.868      0.000       9.240      16.620
                             Regime 2 parameters
==============================================================================
                 coef    std err          z      P>|z|      [0.025      0.975]
------------------------------------------------------------------------------
const          0.5306      0.053      9.986      0.000       0.426       0.635
x1             0.8607      0.011     78.397      0.000       0.839       0.882
x2            -0.0106      0.010     -1.098      0.272      -0.030       0.008
sigma2         1.8866      0.165     11.414      0.000       1.563       2.211
                         Regime transition parameters
==============================================================================
                 coef    std err          z      P>|z|      [0.025      0.975]
------------------------------------------------------------------------------
p[0->0]        0.9753      0.004    252.383      0.000       0.968       0.983
p[1->0]        0.0003      0.034      0.009      0.992      -0.067       0.068
p[2->0]        0.0315      0.005      6.662      0.000       0.022       0.041
p[0->1]     1.933e-06      0.003      0.001      0.999      -0.005       0.005
p[1->1]        0.9379      0.027     35.374      0.000       0.886       0.990
p[2->1]        0.0083      0.003      3.074      0.002       0.003       0.014
==============================================================================

Warnings:
[1] Covariance matrix calculated using numerical (complex-step) differentiation.

======================================================================
REGIME ANALYSIS: 3 regimes, switching variance, lag1 & lag20
======================================================================

Expected Regime Durations:
Regime 0: 40.55 days (0.16 years)
Regime 1: 16.11 days (0.06 years)
Regime 2: 25.15 days (0.10 years)

Regime Mean Returns:

Transition Probability Matrix:
          To_0    To_1    To_2
From_0  0.9753  0.0003  0.0315
From_1  0.0000  0.9379  0.0083
From_2  0.0247  0.0617  0.9602

======================================================================
REGIME PERIOD STATISTICS
======================================================================

Regime 0:
Frequency: 3428 days (53.5%)
Mean return: 2.248%
Std dev: 1.572%
Min: -1.706%
Max: 9.420%
Longest period: 343 consecutive days

Regime 1:
Frequency: 320 days (5.0%)
Mean return: 6.948%
Std dev: 5.925%
Min: -5.268%
Max: 28.478%
Longest period: 74 consecutive days

Regime 2:
Frequency: 2658 days (41.5%)
Mean return: 3.322%
Std dev: 2.837%
Min: -3.513%
Max: 14.941%
Longest period: 131 consecutive days

Generating visualizations...
Saved: markov_regime_probabilities.png
Saved: markov_regime_overlay.png
Caveats
- This pipeline fits regimes on a forward-looking target (20-day forward max return).
- Score/regime labels are model-dependent: “Regime 1” here means the regime with the estimated characteristics above (rare + high dispersion), not a universal mapping.
- The best model was selected by in-sample BIC on the training period.