SMI: Stochastic Momentum Reversion
A highly robust mean-reversion system that identifies deep value entries within medium-term volatility cycles.
View Script - Github Repository
Strategy Profile
| Metric | Value |
|---|---|
| Logic Class | Mean Reversion / Oscillator |
| Primary Tickers | GS, MSFT, HD, V, SHW, CAT, MCD, UNH, AXP |
| Validation Status | Very Robust (-19.4% Degradation) |
| Best Optimization Score | 1.1200 (Sharpe) |
| Global Holdout Sharpe | 1.06 (2023–2025) |
| Risk Profile | Moderate (Counter-Trend Entry) |
Overview
The Stochastic Momentum Index (SMI) measures the position of the close relative to the midpoint of the High/Low range (-100 to +100), rather than the absolute Low used in traditional Stochastics.
This strategy filters for “Deep Oversold” regimes—where price deviates significantly below the midpoint—and triggers entries only when momentum confirms a reversal (signal line crossover). Recent optimization suggests a preference for medium-term lookbacks (approx. 2 months) combined with early profit taking (lower exit thresholds), resulting in high win rates in recent market regimes.
Signal Logic Specification
The strategy employs a precise sequence of market state detection followed by a momentum trigger.
1. Indicator Calculation
- Range Calculation: Determine the Highest High and Lowest Low over a lookback period \(k\).
- Midpoint Deviation: Calculate the difference between the current Close and the Midpoint of that range.
- Double Smoothing: Apply an Exponential Moving Average (EMA) of period \(d\) to the result, and then apply the EMA again. This eliminates noise lag.
- Normalization: The result is scaled between -100 and +100.
2. Entry Logic (Long)
A buy signal requires the convergence of extreme valuation and immediate momentum recovery:
- Deep Value Filter: The SMI value must drop below a strict Oversold Threshold (e.g., -58). This ensures the asset is trading at a significant discount relative to its recent range.
- Momentum Crossover: The SMI line must cross above its own Signal Line (EMA). This confirms the bottom has likely formed.
3. Exit Logic
The trade is closed on trend exhaustion:
- Overextension: The Signal line must be above the Overbought Threshold (e.g., 53).
- Momentum Loss: The SMI line crosses below the Signal Line.
Global Optimization & Parameters
The strategy was optimized using a Walk-Forward framework. The best-performing configuration emphasizes a longer lookback period and a lower exit threshold than standard implementations.
| Parameter | Value | Role | Stability (CV) | Assessment |
|---|---|---|---|---|
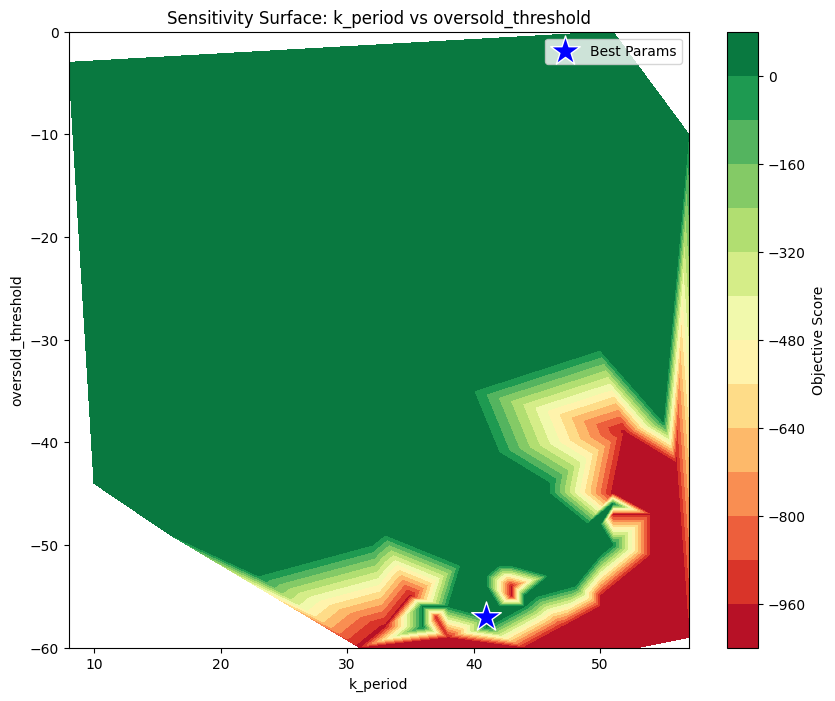
| k_period | 41 | Cycle Lookback | 0.090 | Excellent |
| d_period | 2 | Signal Reactivity | 0.213 | Poor |
| oversold_threshold | -57 | Entry Filter | 0.081 | Excellent |
| overbought_threshold | 37 | Exit Filter | 0.115 | Good |
Interpretation
- Lower Exit Threshold (37): Unlike previous iterations using 50+, the optimal exit threshold is 37. This indicates the strategy performs better by securing profits earlier in the rebound phase rather than waiting for fully overextended conditions.
- Lookback (41): The strategy remains tuned to a ~2-month cycle, filtering out short-term noise.
- Sensitivity: The
d_periodremains unstable, suggesting signal timing is highly sensitive to the smoothing factor.
Robustness Analysis
1. Degradation Analysis
- Avg Sharpe Degradation: -19.42%
- Assessment: Very Robust.
- A negative degradation indicates that the strategy performed significantly better in the Out-of-Sample (OOS) periods than in the In-Sample optimization. This suggests the logic is not overfit and adapts well to unseen data.
2. Parameter Importance (MDI)
Feature importance analysis reveals which parameters drive the strategy’s alpha:
| Parameter | Importance | Interpretation |
|---|---|---|
| k_period | 44.13% | The lookback window is the primary determinant of success. |
| oversold_threshold | 34.41% | The entry filter level is the secondary driver. |
| d_period | 15.65% | Signal smoothing contributes moderately. |
| overbought_threshold | 5.81% | The specific exit level is the least important factor. |
- Primary Drivers:
k_period(44%) andoversold_threshold(34%) account for nearly 80% of the strategy’s performance variance. Both parameters exhibit “Excellent” stability, reinforcing confidence in the core logic. - Secondary Drivers: The exit threshold and smoothing factor are less critical to the strategy’s overall edge.
3. Sensitivity Surface (k_period (44%) and oversold_threshold (34%))
Global Holdout Results (2023–2025)
The strategy was tested on a pristine holdout dataset (post-optimization).
1. Performance Summary
| Metric | Result |
|---|---|
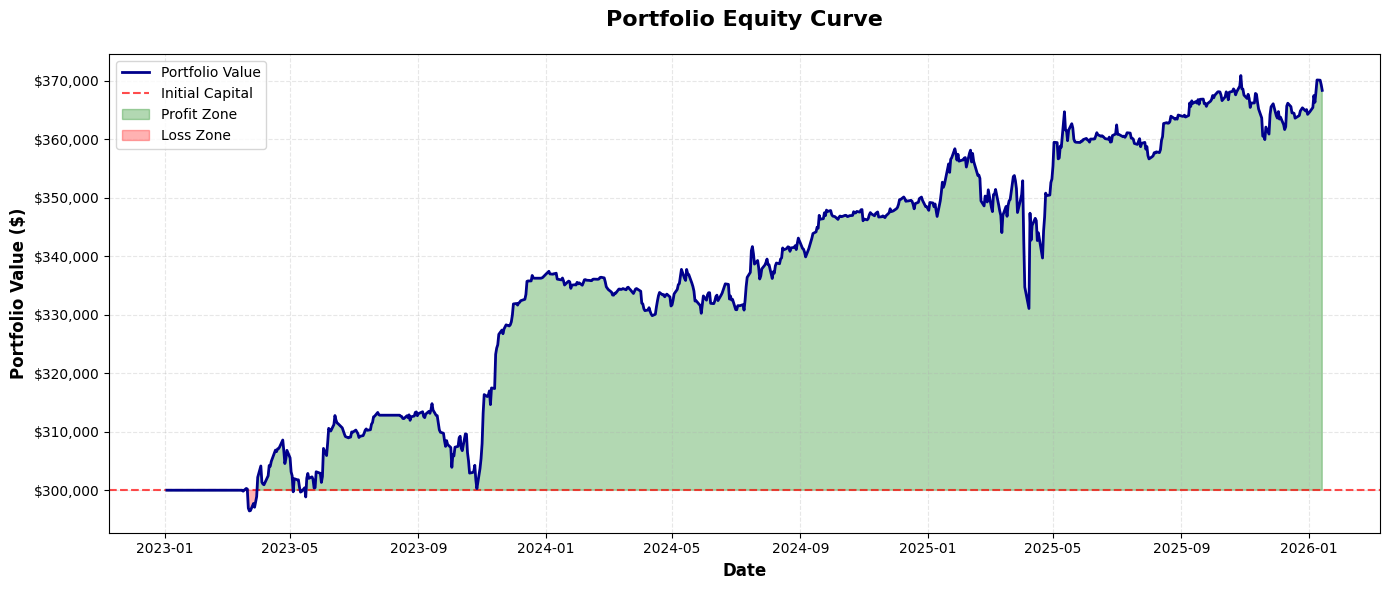
| Total Return | 22.79% |
| Sharpe Ratio | 1.06 |
| Sortino Ratio | 1.41 |
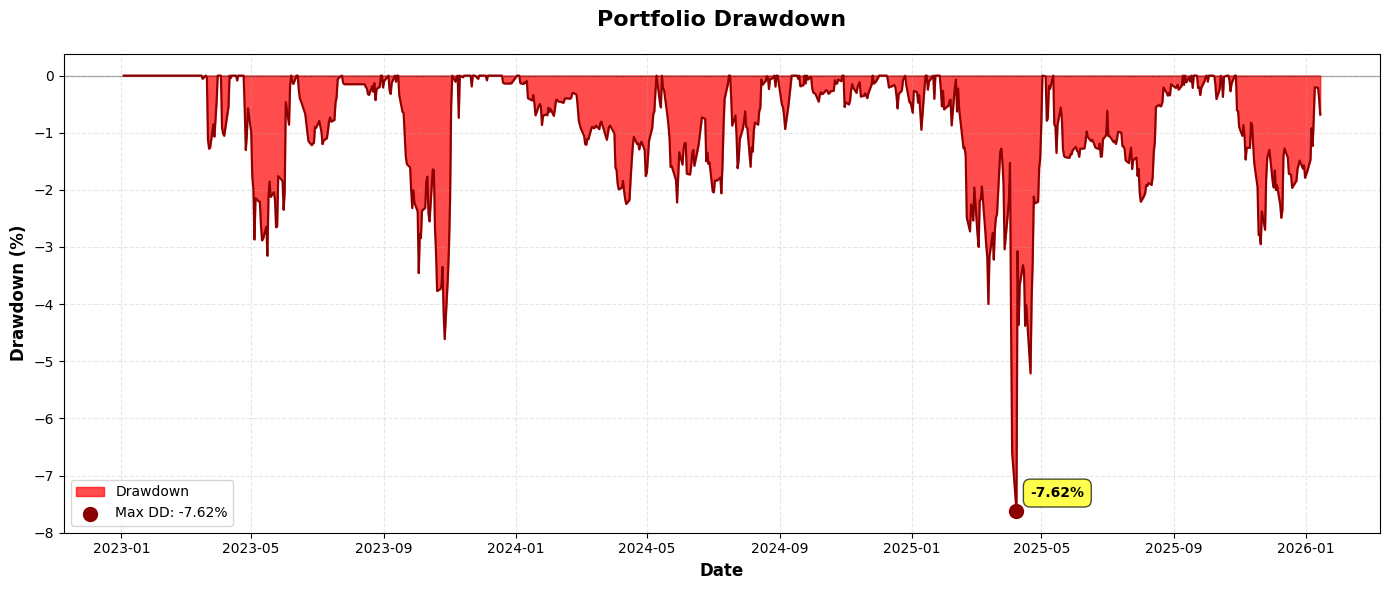
| Max Drawdown | -7.62% |
| Win Rate | 84.62% |
| Profit Factor | 7.89 |
2. Trade Statistics
- Total Trades: 39
- Avg Trade: $1,776.94
- Best/Worst: +$7,929 / -$4,016
3. Portfolio Equity Curve
4. Portfolio Drawdown
5. Strategy Signals (Ticker - V)
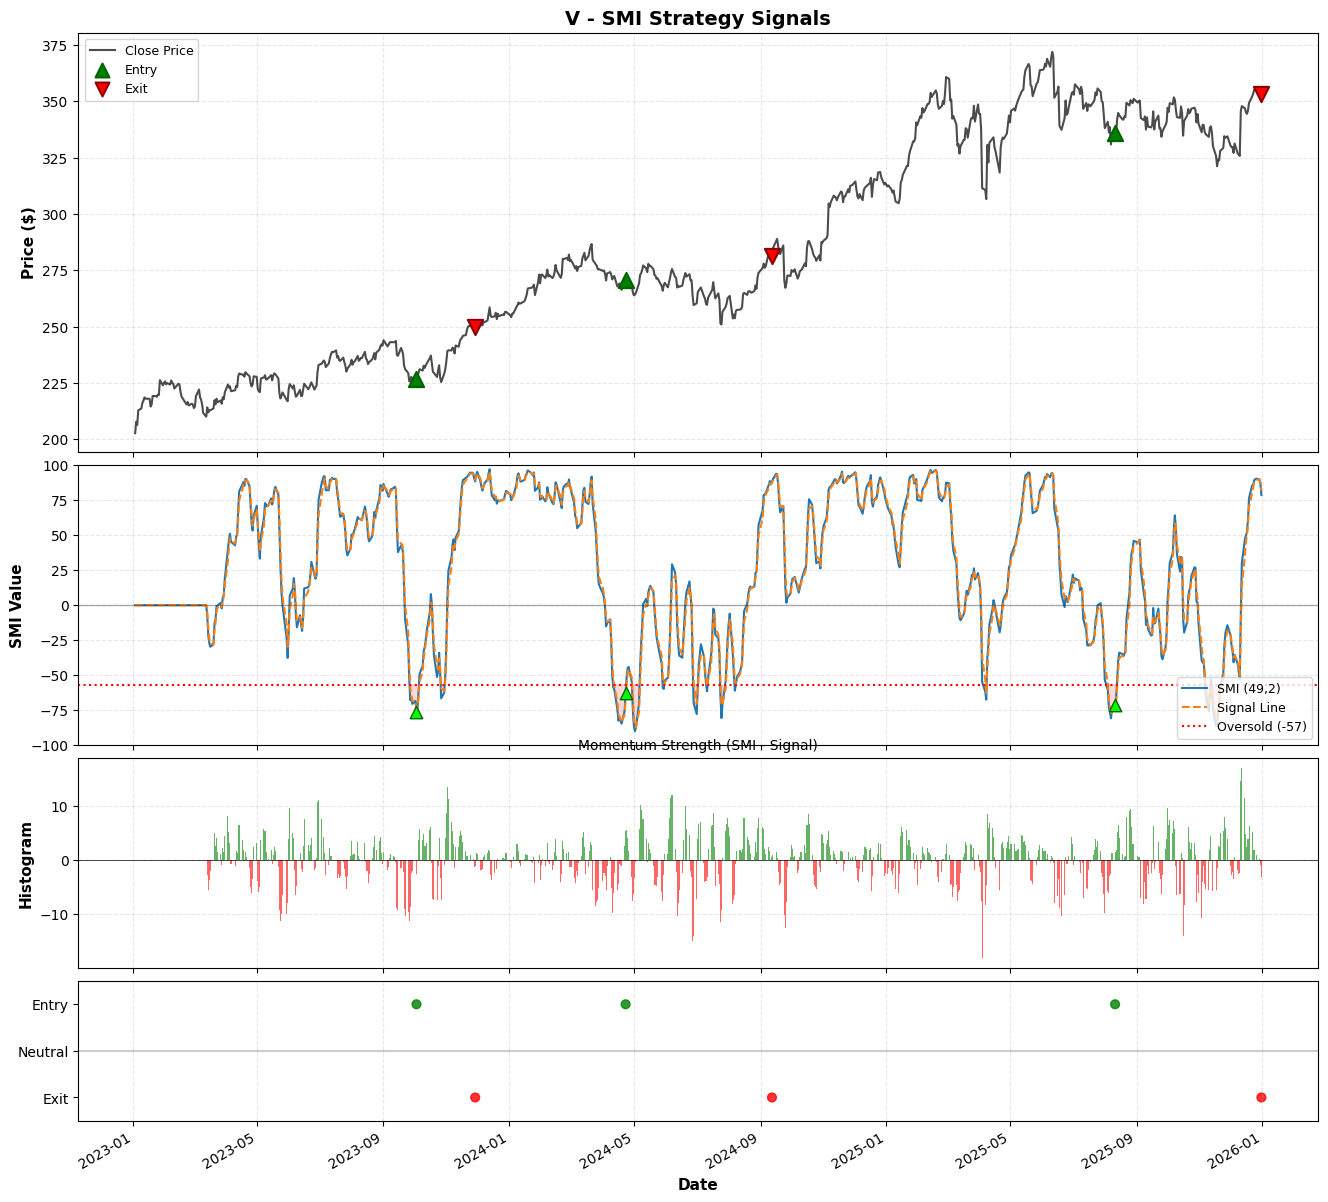
View Strategy Signals Script for All Tickers
Conclusion
The SMI strategy demonstrates high statistical robustness. The shift to a lower overbought_threshold (37) has resulted in a system that captures mean-reversion profits more reliably (84% win rate). The negative degradation score strongly suggests the model is capturing a persistent market anomaly rather than fitting to noise.