MABW: Volatility Breakout Strategy
A systematic trend-following strategy that exploits volatility clustering by entering trends during periods of extreme compression and exiting during excessive expansion.
View Script - Github Repository
Strategy Profile
| Metric | Value |
|---|---|
| Logic Class | Volatility Expansion / Breakout |
| Primary Tickers | GS, MSFT, HD, V, SHW, CAT, MCD, UNH, AXP |
| Validation Status | Rejected (100% Degradation) |
| Trade Frequency | Ultra-Low (~0.5 trades/ticker/year) |
| Optimization Score | -999.0 (Failed Convergence) |
Overview
The MABW (Moving Average Band Width) strategy is predicated on the Volatility Clustering hypothesis. It posits that extended periods of low volatility are structural precursors to significant price expansions. The strategy identifies “Regime Squeezes”—where the spread between a Fast and Slow Moving Average hits a historical low—and enters positions only when a momentum trigger (EMA) confirms a breakout from this compression.
Signal Logic
The strategy utilizes a functional, state-free logic flow using vectorized boolean operations.
1. Indicator Construction
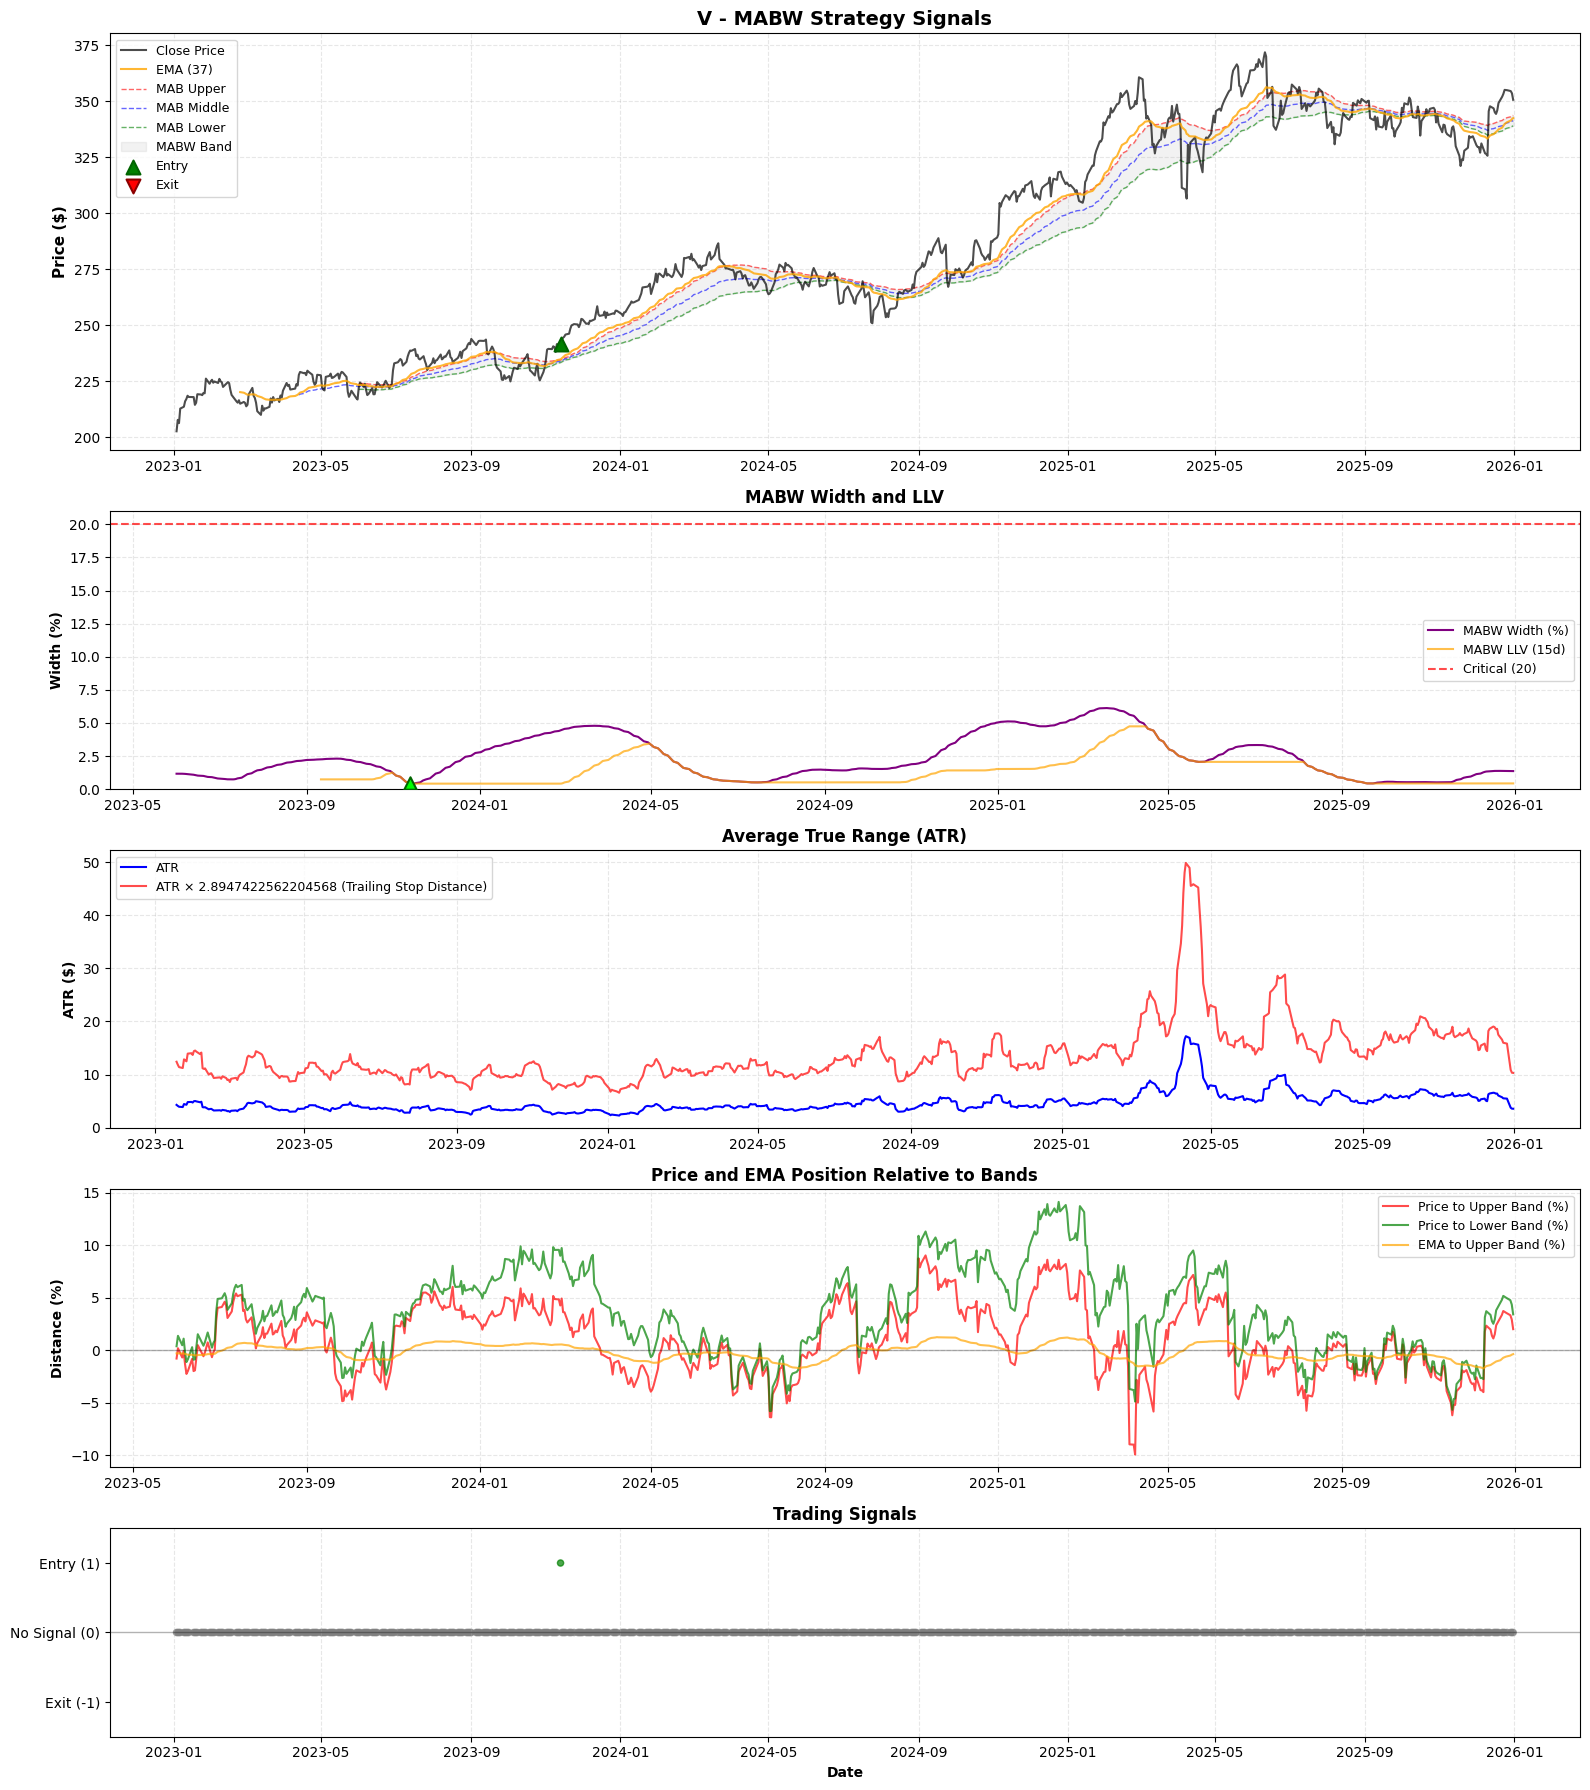
- MABW Bands: Defined by the spread between a Fast MA and a Slow MA, scaled by a multiplier. \(\text{Width} = \text{MA}_{fast} - \text{MA}_{slow}\)
- Regime Filter (LLV): The Lowest Low Value of the
Widthover a lookback period \(N\). - Trigger: An Exponential Moving Average (EMA) of the Close price.
2. Entry Signal (Long Only)
A buy signal is generated if and only if both conditions are met simultaneously:
- Compression (Squeeze): The current Band Width is at its \(N\)-day low. \(\text{Width}_t \le \text{LLV}(\text{Width}, \text{Period}_{LLV})\)
- Breakout (Momentum): The Signal EMA crosses above the Upper Band. \((\text{EMA}_t > \text{UpperBand}_t) \land (\text{EMA}_{t-1} \le \text{UpperBand}_{t-1})\)
3. Exit Signal
The trade is closed when volatility expands beyond a sustainable threshold (Blow-off), indicating trend exhaustion.
\[\text{Signal}_{Exit} = \text{Width}_t > \text{Critical Threshold}_{Width}\]Configuration & Performance
The following configuration was identified during the global search but is considered unstable.
| Parameter | Optimized Value | Description |
|---|---|---|
fast_period | 35 | Fast MA Lookback |
slow_period | 70 | Slow MA Lookback |
multiplier | 0.86 | Band Width Scaler |
ema_period | 37 | Breakout Signal Line |
mabw_llv_period | 15 | Squeeze Definition Lookback |
mab_width_critical | 20 | Exit Threshold |
Robustness & Validation Analysis
The strategy completely failed the Walk-Forward Validation phase.
1. Degradation Analysis
- Sharpe Degradation: 100.00%
- Assessment: Critical Failure. The strategy performs significantly worse on unseen data than during training. The optimization score of
-999.0suggests the optimizer could not find a region that satisfied minimum stability constraints.
2. Parameter Stability (Cluster Analysis)
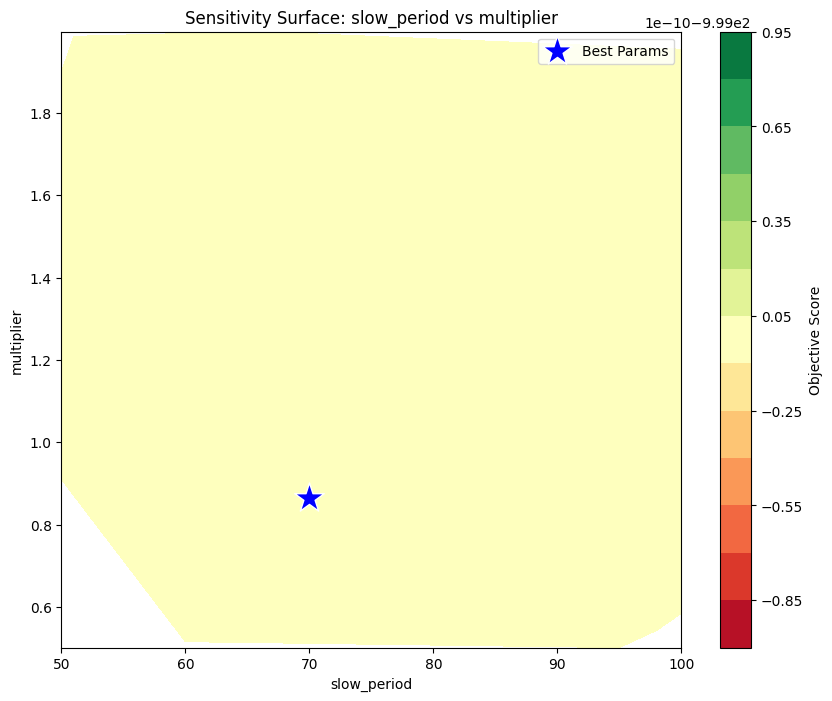
The optimization surface is chaotic. The Coefficient of Variation (CV) is high for almost all parameters, indicating that small adjustments break the strategy.
| Parameter | Stability (CV) | Assessment |
|---|---|---|
slow_period | 0.197 | Moderate |
mab_width_critical | 0.333 | Poor |
multiplier | 0.359 | Poor |
ema_period | 0.468 | Poor |
mabw_llv_period | 0.547 | Poor |
3. Parameter Importance
The importance analysis returned 0.0 for all parameters. This statistical anomaly typically occurs when the “Performance vs Parameter” relationship is non-linear or random, further confirming that the strategy’s success in the backtest was random chance rather than structural edge.
Sensitivity Surface:
Global Holdout Results (2023–2025)
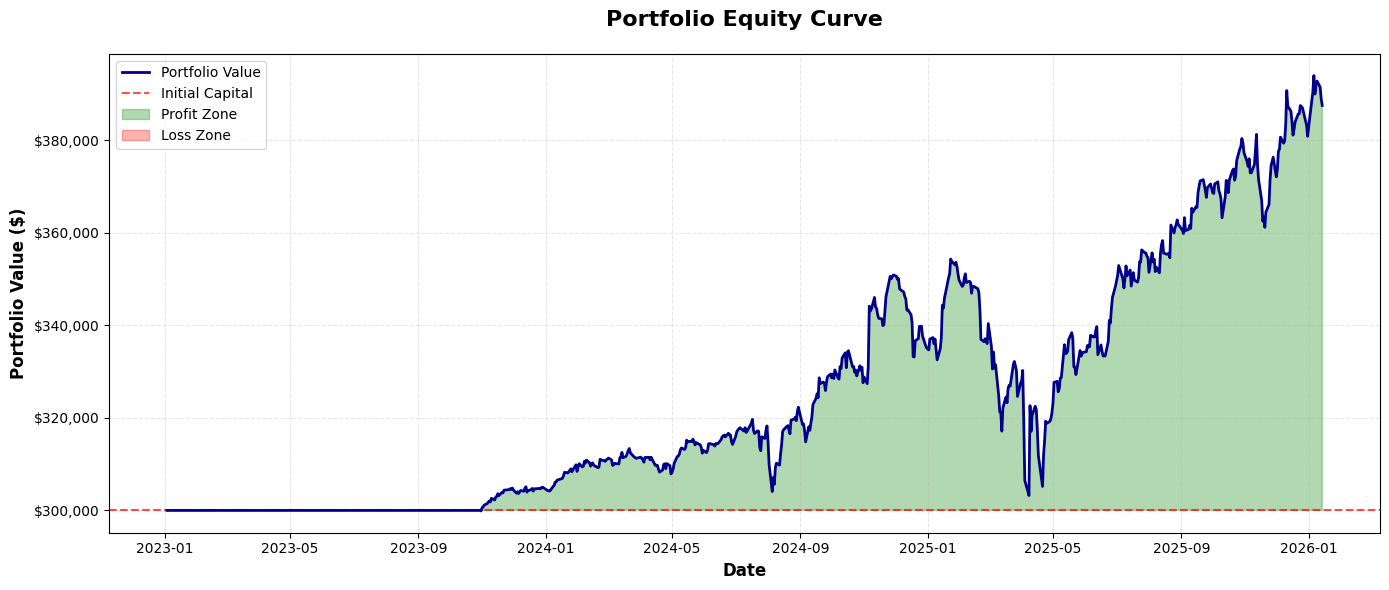
1. Performance Summary
- Total Return: 29.19%
- Sharpe Ratio: 0.92
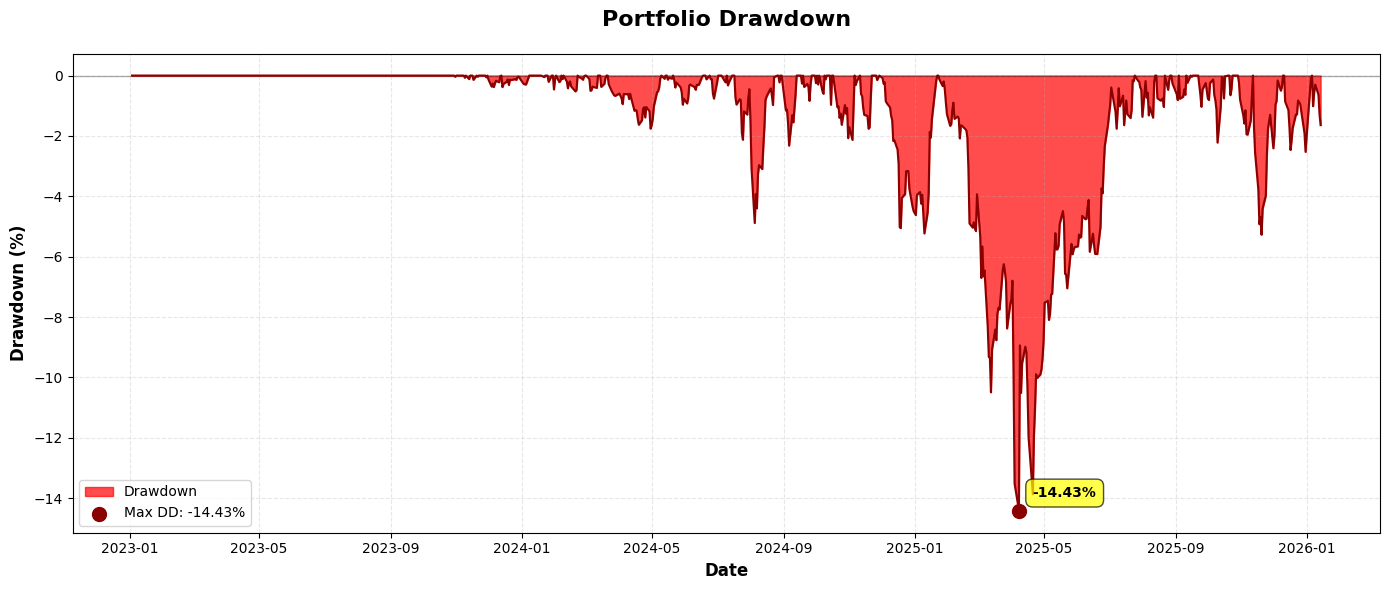
- Max Drawdown: -14.43%
- Win Rate: 77.78%
- Profit Factor: 6.97
- Total Trades: 9
2. Observation
The extremely high Profit Factor (6.97) coupled with very low trade count (9 trades across 9 tickers over ~3 years) confirms the strategy is “cherry-picking” specific high-magnitude trends (likely in MSFT or CAT) rather than exploiting a recurring market inefficiency.
3. Portfolio Equity Curve
4. Portfolio Drawdown
5. Strategy Signals (Ticker - V)
View Strategy Signals Script for All Tickers
Conclusion
REJECT FOR PRODUCTION.
The MABW strategy is a classic example of Curve Fitting.
- Diagnosis: It found a specific combination of
ema_period(37) andmabw_llv_period(15) that happened to align with a few massive trends in the specific ticker set (GS, MSFT, etc.). - Prognosis: It is extremely unlikely to repeat this performance. The logic is too rigid (
ema_periodandmabw_llv_periodare unstable) to adapt to future volatility regimes.