Systematic Trading Strategies & Backtesting
Systematic trading algorithms validated through Walk-Forward Analysis.
Performance Matrix
The following table summarizes the current status of the strategy pipeline. Strategies are graded based on their Out-of-Sample (OOS) robustness and parameter stability.
| Strategy | Logic Class | Validation Status | Risk Profile | Script |
|---|---|---|---|---|
| SMI Momentum | Mean Reversion / Oscillator | Very Robust (-19.4% Degradation) | Moderate (High Win Rate) | View Script |
| AMA-KAMA | Dual Adaptive Trend / Mean Reversion | Robust (35.66% Degradation) | Conservative | View Script |
| MABW | Volatility Expansion / Breakout | Rejected (100% Degradation) | Aggressive / Unstable | View Script |
Strategy Summaries
1. SMI (Stochastic Momentum Index)
A highly robust mean-reversion system that identifies deep value entries within medium-term volatility cycles.
- Concept: This strategy filters for “Deep Oversold” regimes—where price deviates significantly below the midpoint—and triggers entries only when momentum confirms a reversal (signal line crossover).
- Status: High win rate with low parameter degradation (-19.4%).
- Strategy Signals : Example ticker -
V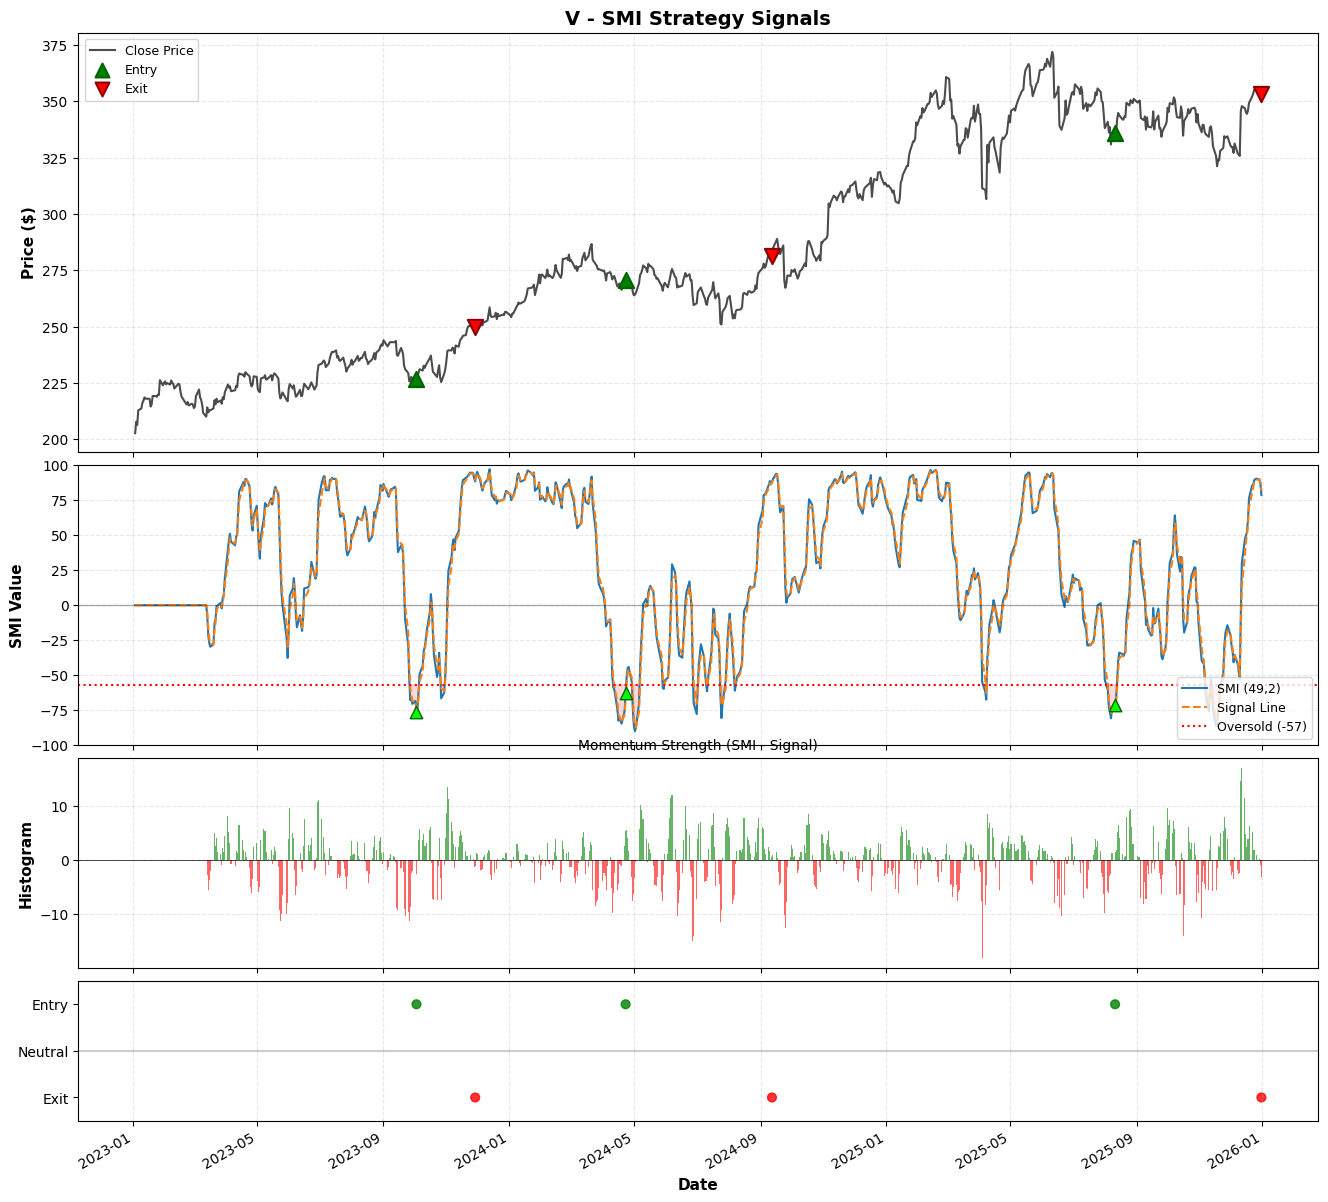
2. AMA-KAMA (Dual Adaptive Momentum)
A trend-reversion system that pairs two variations of Perry Kaufman’s Adaptive Moving Average to identify high-fidelity entries, filtered by volatility regimes.
- Concept: By using two adaptive averages, the strategy dynamically adjusts its crossover sensitivity. In chop/noise, both lines flatten, reducing false signals.
- Status: High robustness with low parameter degradation (35%).
- Strategy Signals : Example ticker -
V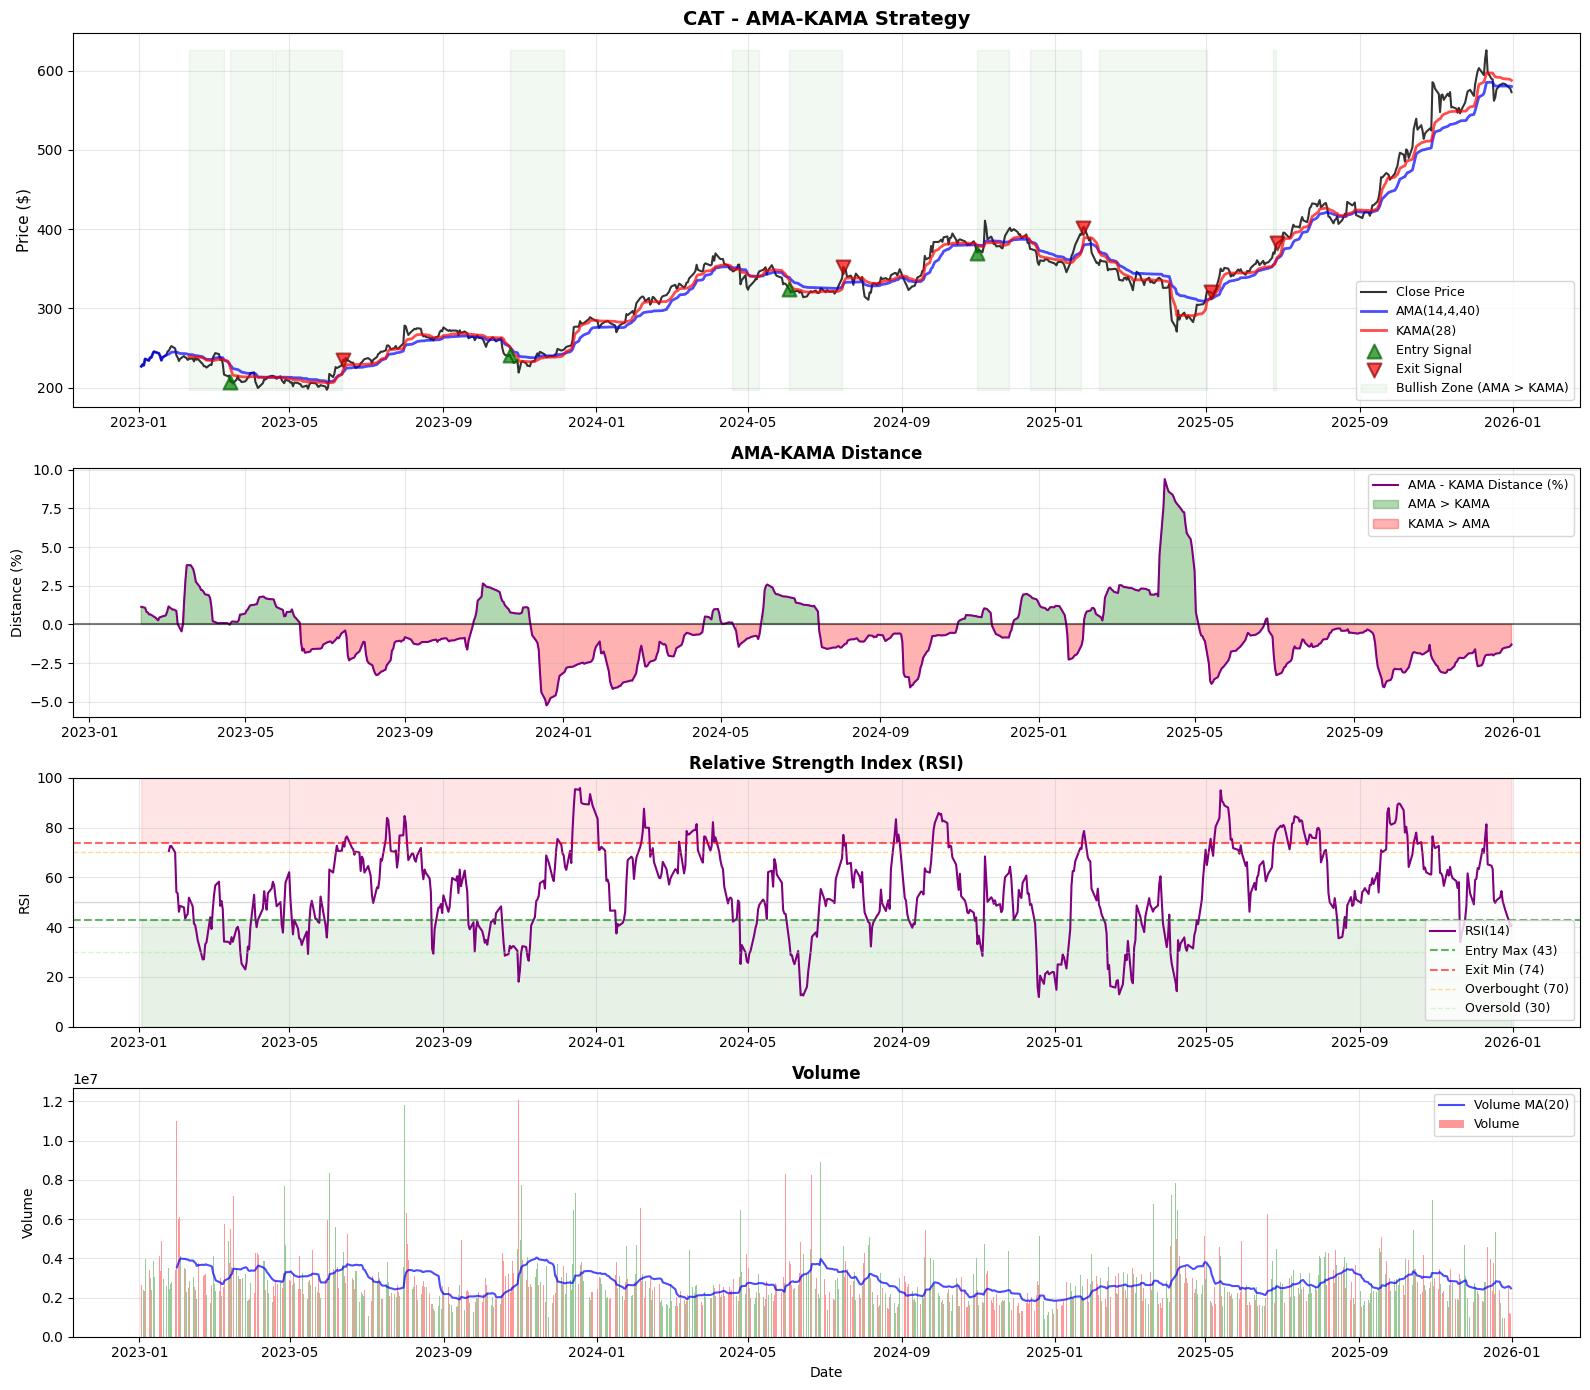
3. MABW (Moving Average Band Width)
A systematic trend-following strategy that exploits volatility clustering by entering trends during periods of extreme compression and exiting during excessive expansion.
- Concept: The MABW (Moving Average Band Width) strategy is predicated on the Volatility Clustering hypothesis. It posits that extended periods of low volatility are structural precursors to significant price expansions. The strategy identifies “Regime Squeezes”—where the spread between a Fast and Slow Moving Average hits a historical low—and enters positions only when a momentum trigger (EMA) confirms a breakout from this compression.
- Status: Failed Validation. The strategy exhibited 100% performance degradation in out-of-sample testing, indicating severe overfitting to historical anomalies.